

CSI COMPRESSCO LP ANNOUNCES FOURTH QUARTER AND TOTAL YEAR 2021 RESULTS
THE WOODLANDS, Texas, March 10, 2022 /PRNewswire/ -- CSI Compressco LP ("CSI Compressco", "CCLP" or the "Partnership") (NASDAQ: CCLP) today announced fourth quarter and total year 2021 results.

The operating results presented throughout this document include the operating results of Spartan Treating due to the previously reported acquisition on November 10, 2021. As the Partnership and Spartan Treating were under common control at the time of Spartan's acquisition of the Partnership's general partner, the results of operations have been combined for the Partnership and Spartan Treating from the date of common control, which was January 29, 2021. As a result, operating results and certain financial metrics for the third quarter 2021 vary from what we previously reported.
Fourth Quarter 2021 Summary
- Total revenues for the fourth quarter were $80.2 million compared to $77.7 million in the third quarter 2021.
- Net loss was $17.2 million, including $7.0 million in non-recurring charges compared to a net loss of $10.6 million in the third quarter 2021, including $0.3 million in non-recurring charges.
- Adjusted EBITDA was $26.4 million compared to $25.7 million in the third quarter 2021. Fourth quarter Adjusted EBITDA included a $1.2 million benefit from the sale of used equipment compared to a $1.0 million benefit from the sale of used equipment in the third quarter 2021.
- Distributable cash flow was $9.3 million compared to $10.7 million in the third quarter of 2021.
- Distribution coverage ratio was 6.6x compared to 21.9x in the third quarter of 2021.
- Fourth quarter distribution of $0.01 per common unit was paid on February 14, 2022.
- Raised $57 million in private placements of common equity.
- On December 13, 2021, redeemed all of the $80.7 million unsecured notes due in August 2022.
- Net leverage ratio was 6.2x at the end of the fourth quarter compared to 6.8x at the end of the third quarter.
Total Year 2021 Summary
- Total revenues for 2021 were $304.2 million compared to $301.6 million in 2020.
- Net loss was $50.3 million compared to $73.8 million in 2020.
- Adjusted EBITDA was $101.8 million compared to $108.8 million in 2020. Adjusted EBITDA in 2021 includes a $2.9 million benefit from the sale of used equipment compared to $13.1 million in 2020.
- Distributable cash flow was $38.1 million compared to $35.0 million in 2020.
- Long-term debt, net as of December 31, 2021 totals $631.1 million compared to $638.6 million as of December 31, 2020
- Total compression fleet utilization increased to 80.8% as of December 31, 2021 from 76.4% as of December 31, 2020.
Fourth Quarter 2021
John Jackson, CEO of CSI Compressco commented, "The fourth quarter of 2021 concluded a very active year for CCLP. During 2021, CSI Compressco was able to maintain its core EBITDA, raise significant equity from third parties, acquire the primary business from Spartan Energy Partners and redeem the 2022 debt maturity. This allowed us to significantly improve our balance sheet as we move into a more robust natural gas environment. We remain excited about how these transactions have positioned CSI Compressco for the future. In addition, in early 2022 we concluded our Transition Services Agreement with TETRA. As we moved away from the shared service model with TETRA, this allowed CSI Compressco to select and install its own stand-alone ERP system. Our employees have been working on this over the course of 2021 and in January 2022, we transitioned to a new ERP system."
"The overall business environment for natural gas as well as the compression industry continued to improve over the 2nd half of 2021. This pick-up in activity in the industry was reflected in our 4th quarter operations as we increased our revenue-generating horsepower by over 35,000 horsepower. This was a combination of new build compression, re-deploying idle fleet units and the acquisition of Spartan's compression business. In addition, we have seen success in selling compression and gas treating products to both the Spartan and CSI Compressco legacy customers and are actively quoting a number of combined product opportunities for 2022. We have been increasing our revenue rates to customers to reflect the increasing cost environment and plan to continue this into 2022 as we work to improve our overall profit margins."
"We continue to see strong interest from our customers both in the US and internationally. As the lead times increase for various components, our customers are increasingly planning further out to have the desired equipment in time to meet their budgeted projects for 2022 and into 2023. In addition to traditional gas engine compression activity, we have seen an uptick in interest in ESG initiatives from our customers, resulting in an increase in our electric motor drive units for contract services. As a result, we have been awarded some electric motor units that will be deployed throughout the course of 2022. We are in active discussions with multiple customers for 2022 and 2023 for additional electric units. We expect this demand for electric motor drive horsepower to continue to grow but continue to believe there will be a strong desire for both gas engines and electric motor drive for the foreseeable future. The continuing focus on sound capital allocation and improving execution will allow CSI Compressco to continue to strengthen its balance sheet over the course of 2022 and into 2023 and position CSI Compressco to continue to grow effectively as we move forward."
Net cash provided by operating activities was $4.2 million in the fourth quarter 2021 compared to $22.9 million in the third quarter. Our year-end liquidity was $32.7 million, compared to $34.7 million at the end of the third quarter of 2021 and $30.8 million at the end of 2020. Liquidity is defined as unrestricted cash on hand plus availability under our revolving credit facilities.
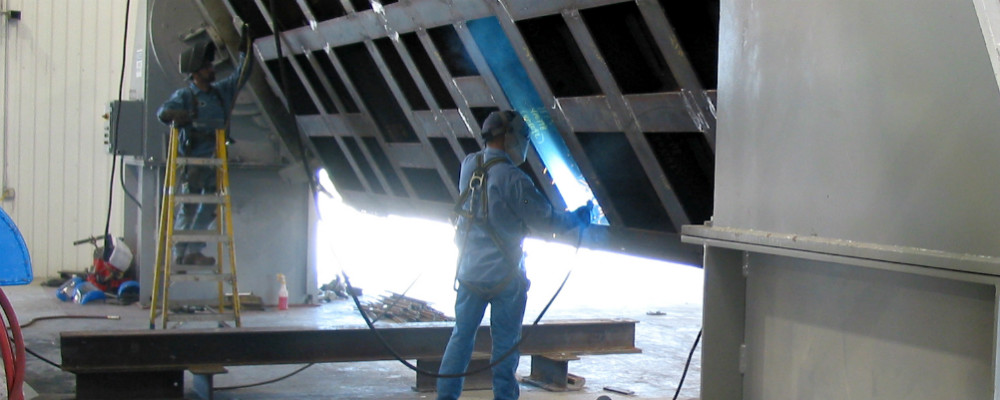
In the second quarter of 2020, the Partnership announced that it was exiting the fabrication business with the final shipment of new units occurring in the fourth quarter of 2020. As a result, the financial results for the Partnership's fabrication business are reported as discontinued operations.
This press release includes the following financial measures that are not presented in accordance with generally accepted accounting principles in the United States ("U.S. GAAP"): Adjusted EBITDA, distributable cash flow, distribution coverage ratio, free cash flow, and net leverage ratio. Please see Schedules B-D for reconciliations of these non-GAAP financial measures to the most directly comparable U.S. GAAP measures.
Unaudited results of operations for the quarter ended December 31, 2021 compared to the prior quarter and the corresponding prior year quarter are presented in the table below.
Three Months Ended | ||||||||
December 31, | September 30, | December 31, | ||||||
(In Thousands) | ||||||||
Net loss | $ | (17,236) | $ | (10,636) | $ | (23,025) | ||
Adjusted EBITDA | $ | 26,381 | $ | 25,689 | $ | 26,185 | ||
Distributable cash flow | $ | 9,254 | $ | 10,684 | $ | 7,653 | ||
Net cash provided by (used in) operating activities | $ | 4,155 | $ | 22,884 | $ | 7,033 | ||
Free cash flow | $ | (21,287) | $ | 15,918 | $ | 757 | ||
As of December 31, 2021, service compressor fleet horsepower was 1,196,842 and fleet horsepower in service was 967,085 (we define the overall service fleet utilization rate as the service compressor fleet horsepower in service divided by the total compressor fleet horsepower). Idle horsepower equipment under repair is not considered utilized, but we do count units on standby as utilized when the client is being billed a standby service rate.
Balance Sheet
Cash on hand at the end of the fourth quarter was $6.6 million. As of December 31, 2021, we had $59.8 million outstanding on the Partnership's credit facilities at the end of the fourth quarter. Our debt maturity schedule reflects $400.0 million of first lien secured bonds due in April 2025 and $172.7 million of second lien secured bonds due in April 2026. Net leverage ratio at December 31, 2020 was 6.2x.
Capital Expenditures
We expect capital expenditures in 2022 to range from $50.0 million to $60.0 million. These capital expenditures include approximately $18.0 million to $22.0 million of maintenance capital expenditures, approximately $24.0 million to $28.0 million of capital expenditures primarily associated with the expansion of our contract services fleet, and $8.0 million to $10.0 million of capital expenditures related to investments in technology, primarily software and systems.
Fourth Quarter 2021 Cash Distribution on Common Units
On January 20, 2022, CSI Compressco announced that the board of directors of its general partner declared a cash distribution attributable to the fourth quarter of 2021 of $0.01 per outstanding common unit, which was paid on February 14, 2022, to common unitholders of record as of the close of business on January 31, 2022. The distribution coverage ratio for the fourth quarter of 2021 was 6.6x.
Conference Call
CSI Compressco will host a conference call to discuss fourth quarter and total year 2021 results today, March 10, 2022, at 10:30 a.m. Eastern Time. The phone number for the call is 1-866-374-8397. The conference call will also be available by live audio webcast and may be accessed through CSI Compressco's investor relations website at http://ir.csicompressco.com/events-and-webcasts. An audio replay of the conference call will be available at 1-877-344-7529, conference number 10164405, for one week following the conference call and the archived webcast will be available through CSI Compressco's website for thirty days following the conference call.
CSI Compressco Overview
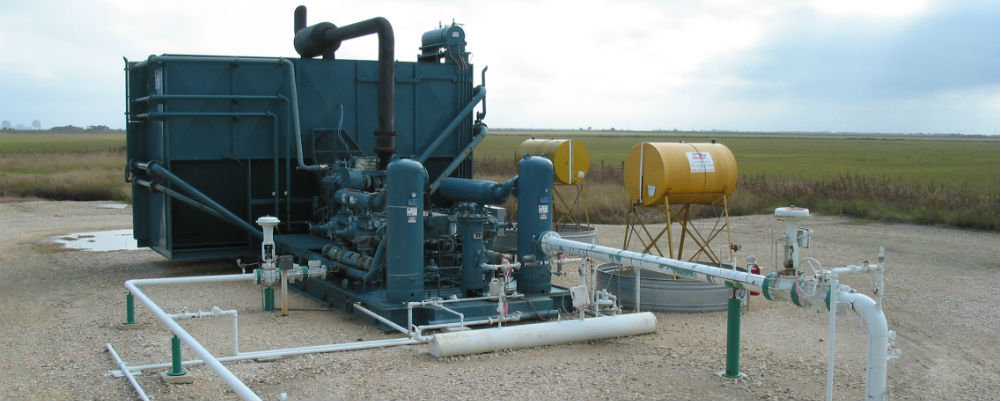
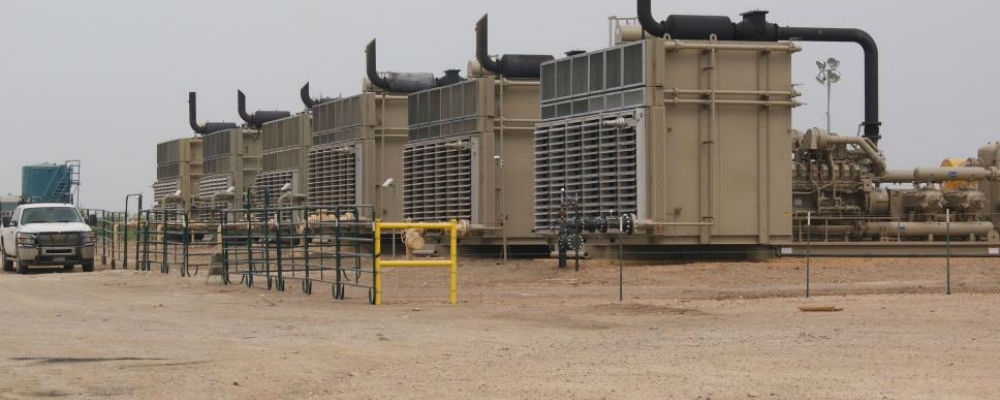
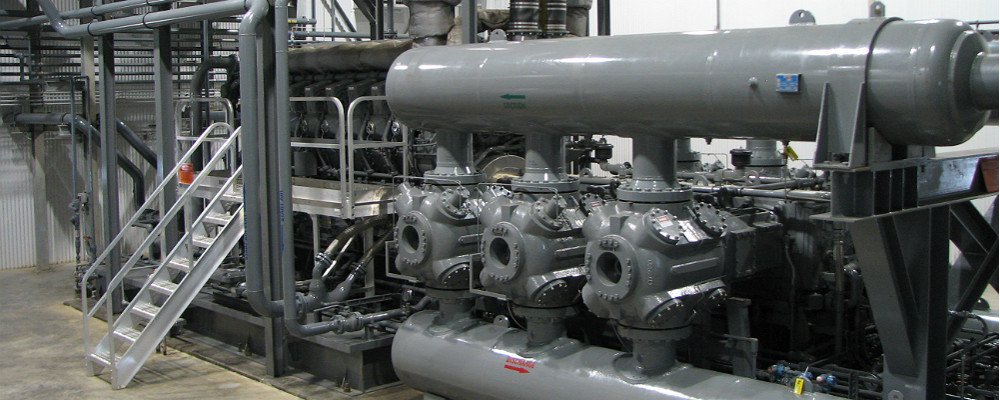
CSI Compressco is a provider of contract services including natural gas compression services and treating services. Natural gas compression is used for natural gas and oil production, gathering, artificial lift, transmission, processing, and storage. Treating services include removal of contaminants from a natural gas stream and cooling to reduce the temperature of produced gas and liquids. CSI Compressco's compression and related services business includes a fleet of approximately 4,800 compressor packages providing approximately 1.2 million in aggregate horsepower, utilizing a full spectrum of low-, medium- and high-horsepower engines. Our treating fleet includes amine units, gas coolers, and related equipment. CSI Compressco's aftermarket business provides compressor package overhaul, repair, reconfiguration, and maintenance services as well as the sale of compressor package parts and components manufactured by third-party suppliers. Our customers comprise a broad base of natural gas and oil exploration and production, midstream, transmission, and storage companies operating throughout many of the onshore producing regions of the United States, as well as in a number of international locations. including the countries of Mexico, Canada, Argentina, Egypt and Chile. CSI Compressco's General Partner is owned by Spartan Energy Partners LP.
Forward-Looking Statements
This news release contains "forward-looking statements" and information based on our beliefs and those of our general partner, CSI Compressco GP LLC. Forward-looking statements in this news release are identifiable by the use of the following words and other similar words: "anticipates," "assumes," "believes," "budgets," "could," "estimates," "expectations," "expects," "forecasts," "goal," "intends," "may," "might," "plans," "predicts," "projects," "schedules," "seeks," "should," "targets," "will," and "would." These forward-looking statements include statements, other than statements of historical fact, including anticipated return of standby equipment to in service, the redeployment of idle fleet compressors, joint-bidding on potential projects with Spartan, commodity prices and demand for CSI Compressco's equipment and services and other statements regarding CSI Compressco's beliefs, expectations, plans, prospects and other future events, performance, and other statements that are not purely historical. Such forward-looking statements reflect our current views with respect to future events and financial performance, and are based on assumptions that we believe to be reasonable, but such forward-looking statements are subject to numerous risks and uncertainties, including but not limited to: economic and operating conditions that are outside of our control, including the trading price of our common units; the severity and duration of the COVID-19 pandemic and related economic repercussions and the resulting negative impact on the demand for oil and gas, operational challenges relating to the COVID-19 pandemic and efforts to mitigate the spread of the virus, including logistical challenges, remote work arrangements, and supply chain disruptions, other global or national health concerns; the current significant surplus in the supply of oil and the ability of OPEC and other oil producing nations to agree on and comply with supply limitations; the duration and magnitude of the unprecedented disruption in the oil and gas industry; the levels of competition we encounter; our dependence upon a limited number of customers and the activity levels of our customers; our ability to replace our contracts with our customers, which are generally short-term contracts; the availability of adequate sources of capital to us; our existing debt levels and our ability to obtain additional financing or refinancing; our ability to continue to make cash distributions, or increase cash distributions from current levels, after the establishment of reserves, payment of debt service and other contractual obligations; the restrictions on our business that are imposed under our long-term debt agreements; our operational performance; the credit and risk profile of Spartan Energy Partners; ability of our general partner to retain key personnel; risks related to acquisitions and our growth strategy; the availability of raw materials and labor at reasonable prices; risks related to our foreign operations; the effect and results of litigation, regulatory matters, environmental laws and regulations, settlements, audits, assessments, and contingencies; or potential material weaknesses in the future; information technology risks, including the risk of cyberattack; terrorist attack, armed conflict or political or civil unrest; and other risks and uncertainties contained in our Annual Report on Form 10-K and our other filings with the U.S. Securities and Exchange Commission ("SEC"), which are available free of charge on the SEC website at www.sec.gov. The risks and uncertainties referred to above are generally beyond our ability to control and we cannot predict all the risks and uncertainties that could cause our actual results to differ from those indicated by the forward-looking statements. If any of these risks or uncertainties materialize, or if any of the underlying assumptions prove incorrect, actual results may vary from those indicated by the forward-looking statements, and such variances may be material. All subsequent written and verbal forward-looking statements made by or attributable to us or to persons acting on our behalf are expressly qualified in their entirety by reference to these risks and uncertainties. You should not place undue reliance on forward-looking statements. Each forward-looking statement speaks only as of the date of the particular statement, and we undertake no obligation to update or revise any forward-looking statements we may make, except as may be required by law.
Reconciliation of Non-GAAP Financial Measures
The Partnership includes in this release the non-GAAP financial measures Adjusted EBITDA, distributable cash flow, distribution coverage ratio, free cash flow, and net leverage ratio. Adjusted EBITDA is used as a supplemental financial measure by the Partnership's management to:
- assess the Partnership's ability to generate available cash sufficient to make distributions to the Partnership's unitholders and general partner;
- evaluate the financial performance of its assets without regard to financing methods, capital structure or historical cost basis;
- measure operating performance and return on capital as compared to those of our competitors; and
- determine the Partnership's ability to incur and service debt and fund capital expenditures.
The Partnership defines Adjusted EBITDA as earnings before interest, taxes, depreciation and amortization, and before certain charges, including impairments, bad debt expense attributable to bankruptcy of customers, equity compensation, non-cash costs of compressors sold, gain on extinguishment of debt, write-off of unamortized financing costs, and excluding, severance and other non-recurring or unusual expenses or charges.
Distributable cash flow is used as a supplemental financial measure by the Partnership's management, as it provides important information relating to the relationship between our financial operating performance and our cash distribution capability. Additionally, the Partnership uses distributable cash flow in setting forward expectations and in communications with the board of directors of our general partner. The Partnership defines distributable cash flow as Adjusted EBITDA less current income tax expense, maintenance capital expenditures, interest expense, and severance expense, plus non-cash interest expense.
The Partnership believes that the distribution coverage ratio provides important information relating to the relationship between the Partnership's financial operating performance and its cash distribution capability. The Partnership defines the distribution coverage ratio as the ratio of distributable cash flow to the total quarterly distribution payable, which includes, as applicable, distributions payable on all outstanding common units, the general partner interest and the general partner's incentive distribution rights.
The Partnership defines free cash flow as net cash provided by operating activities less capital expenditures, net of sales proceeds. Management primarily uses this metric to assess our ability to retire debt, evaluate our capacity to further invest and grow, and measure our performance as compared to our peer group of companies.
The Partnership defines net leverage ratio as net debt (the sum of the carrying value of long-term and short-term debt on its consolidated balance sheet, less cash, excluding restricted cash on the consolidated balance sheet and excluding outstanding letters of credit) divided by Adjusted EBITDA for calculating net leverage (Adjusted EBITDA as reported externally adjusted for certain items to comply with its credit agreement) for the trailing twelve month period. Management primarily uses this metric to assess the Partnership's ability to borrow, reduce debt, add to cash balances, pay distributions, and fund investing and financing activities.
These non-GAAP financial measures should not be considered an alternative to net income, operating income, cash flows from operating activities or any other measure of financial performance presented in accordance with U.S. GAAP. These non-GAAP financial measures may not be comparable to Adjusted EBITDA, distributable cash flow, free cash flow or other similarly titled measures of other entities, as other entities may not calculate these non-GAAP financial measures in the same manner as CSI Compressco. Management compensates for the limitation of these non-GAAP financial measures as an analytical tool by reviewing the comparable U.S. GAAP measures, understanding the differences between the measures and incorporating this knowledge into management's decision-making process. Furthermore, these non-GAAP measures should not be viewed as indicative of the actual amount of cash that CSI Compressco has available for distributions or that the Partnership plans to distribute for a given period, nor should they be equated to available cash as defined in the Partnership's partnership agreement.
Schedule A - Income Statement | ||||||||||||||
Results of Operations (unaudited) | ||||||||||||||
Three Months Ended | Twelve Months Ended | |||||||||||||
December | September | December | December | December | ||||||||||
(In Thousands, Except per Unit Amounts) | ||||||||||||||
Revenues: | ||||||||||||||
Compression and related services | $ | 63,832 | $ | 59,413 | $ | 52,568 | $ | 237,877 | $ | 227,875 | ||||
Aftermarket services | 13,591 | 13,991 | 12,721 | 53,534 | 60,290 | |||||||||
Equipment rentals | 1,594 | 3,327 | — | 10,024 | — | |||||||||
Equipment sales | 1,172 | 954 | 5,835 | 2,736 | 13,422 | |||||||||
Total revenues | $ | 80,189 | $ | 77,685 | $ | 71,124 | $ | 304,171 | $ | 301,587 | ||||
Cost of revenues (excluding depreciation and amortization expense): | ||||||||||||||
Cost of compression and related services | $ | 32,621 | $ | 30,628 | $ | 26,707 | $ | 118,933 | $ | 108,843 | ||||
Cost of aftermarket services | 11,914 | 11,898 | 10,951 | 45,578 | 52,444 | |||||||||
Cost of equipment rentals | 180 | 291 | — | 834 | — | |||||||||
Cost of equipment sales | 1,504 | 1,492 | 5,540 | 3,342 | 12,946 | |||||||||
Total cost of revenues | $ | 46,219 | $ | 44,309 | $ | 43,198 | $ | 168,687 | $ | 174,233 | ||||
Depreciation and amortization | 19,572 | 19,628 | 20,561 | 78,234 | 80,007 | |||||||||
Impairments of long-lived assets | — | — | 6,493 | — | 15,367 | |||||||||
Insurance recoveries | — | — | — | — | (517) | |||||||||
Selling, general, and administrative expense | 12,231 | 10,264 | 7,991 | 43,299 | 34,295 | |||||||||
Interest expense, net | 13,816 | 13,635 | 13,833 | 54,791 | 54,468 | |||||||||
Other (income) expense, net | 4,364 | (591) | (783) | 3,868 | 3,544 | |||||||||
Loss before taxes and discontinued operations | $ | (16,013) | $ | (9,560) | $ | (20,169) | $ | (44,708) | $ | (59,810) | ||||
Provision for income taxes | 1,234 | 806 | 1,273 | 4,952 | 3,144 | |||||||||
Loss from continuing operations | $ | (17,247) | (10,366) | $ | (21,442) | (49,660) | (62,954) | |||||||
Income (loss) from discontinued operations, net of | $ | 11 | (270) | $ | (1,583) | (612) | (10,886) | |||||||
Net loss | (17,236) | (10,636) | (23,025) | $ | (50,272) | $ | (73,840) | |||||||
Net loss per diluted common unit | $ | (0.17) | $ | (0.22) | $ | (0.49) | $ | (0.81) | $ | (1.54) | ||||
Schedule B - Reconciliation of Net Loss to Adjusted EBITDA, Distributable Cash Flow and Distribution Coverage Ratio | |
The following table reconciles net loss to Adjusted EBITDA, distributable cash flow and distribution coverage ratio for the three month periods ended | |
Results of Operations (unaudited) | ||||||||||||||
Three Months Ended | Twelve Months Ended | |||||||||||||
December 31, | September 30, | December 31, | December 31, | December 31, | ||||||||||
(In Thousands, except Ratios) | ||||||||||||||
Net loss | $ | (17,236) | $ | (10,636) | $ | (23,025) | $ | (50,272) | $ | (73,840) | ||||
Interest expense, net | 13,816 | 13,635 | 13,833 | 54,791 | 54,468 | |||||||||
Provision (benefit) for income taxes | 1,234 | 806 | 1,273 | 4,952 | 3,211 | |||||||||
Depreciation and amortization | 19,572 | 19,628 | 20,651 | 78,234 | 80,533 | |||||||||
Impairments of fixed assets and inventory | — | — | 6,493 | — | 20,841 | |||||||||
Non-cash cost of compressors sold | 1,506 | 1,423 | 5,568 | 3,368 | 12,812 | |||||||||
Expense for unamortized finance costs | — | — | — | — | — | |||||||||
Equity compensation | 479 | 497 | 345 | 2,286 | 1,389 | |||||||||
Transaction costs | 1,838 | — | — | 2,146 | — | |||||||||
ERP Write off | 4,635 | — | — | 4,635 | — | |||||||||
Reorganization costs | 754 | — | — | 754 | — | |||||||||
Debt exchange fees | — | — | 115 | — | 4,892 | |||||||||
Prior year sales tax accrual adjustment | — | — | — | 367 | — | |||||||||
Manufacturing engine order cancellation | — | — | — | 300 | — | |||||||||
Severance | — | — | 194 | 114 | 2,034 | |||||||||
Provision for income taxes, depreciation, | (80) | — | — | 256 | — | |||||||||
Other | (137) | 336 | 828 | (137) | 2,438 | |||||||||
Adjusted EBITDA | $ | 26,381 | $ | 25,689 | $ | 26,185 | $ | 101,974 | $ | 108,778 | ||||
Less: | ||||||||||||||
Current income tax expense | 2,897 | 341 | 1,650 | 4,756 | 2,984 | |||||||||
Maintenance capital expenditures | 2,825 | 2,811 | 4,125 | 12,761 | 18,920 | |||||||||
Interest expense | 13,816 | 13,635 | 13,833 | 54,791 | 54,468 | |||||||||
Severance and other | (137) | 336 | 1,022 | (23) | 4,472 | |||||||||
Plus: | ||||||||||||||
Non-cash items included in interest | 2,274 | 2,118 | 2,098 | 8,592 | 7,108 | |||||||||
Distributable cash flow | $ | 9,254 | $ | 10,684 | $ | 7,653 | $ | 38,101 | $ | 35,042 | ||||
Cash distribution attributable to period | $ | 1,411 | $ | 487 | $ | 480 | $ | 2,869 | $ | 1,918 | ||||
Distribution coverage ratio | 6.56x | 21.94x | 15.94x | 13.28x | 18.27x | |||||||||
Schedule C - Reconciliation of Net Cash Provided by Operating Activities Operations to Free Cash Flow |
The following table reconciles net cash provided by operating activities to free cash flow for the three month periods ended December 31, 2021, |
Results of Operations (unaudited) | ||||||||||||||||
Three Months Ended | Twelve Months Ended | |||||||||||||||
December 31, | September 30, | December 31, | December 31, | December 31, | ||||||||||||
(In Thousands) | ||||||||||||||||
Net cash provided by operating activities | $ | 4,155 | $ | 22,884 | $ | 7,033 | $ | 26,967 | $ | 20,762 | ||||||
Capital expenditures, net of sales proceeds | (25,442) | (6,966) | (6,276) | (42,257) | 4,666 | |||||||||||
Midland facility sale proceeds | — | — | — | — | 17,000 | |||||||||||
Free cash flow | $ | (21,287) | $ | 15,918 | $ | 757 | $ | (15,290) | $ | 25,428 | ||||||
Schedule D – Reconciliation of Net Loss to Adjusted EBITDA for Net Leverage Ratio Calculation (unaudited) | |
(in thousands, except ratios) |
Twelve Months | |
Dec 31, 2021 | |
Net loss | $ (50,272) |
Interest expense, net | 54,791 |
Provision for income taxes | 4,952 |
Depreciation and amortization | 78,234 |
Non-cash cost of compressors sold | 3,368 |
Equity Compensation | 2,286 |
Transaction costs | 2,146 |
ERP Write off | 4,635 |
Reorganization costs | 754 |
Prior year sales tax adjustment | 367 |
Manufacturing engine order cancellation charge | 300 |
Severance | 114 |
Provision for income taxes, depreciation, amortization and | 256 |
Other | (137) |
Adjusted EBITDA | $ 101,794 |
EBITDA adjustments to comply with Credit Agreement | 249 |
Adjusted EBITDA for Net Leverage Calculation | $ 102,043 |
Debt Schedule | Dec 31, 2021 |
7.25% Senior Notes | — |
7.50% First Lien Notes | 400,000 |
10.000%/10.750% Second Lien Notes | 172,717 |
Credit Facilities | 59,836 |
Letters of Credit | 2,114 |
Cash on Hand | (6,598) |
Net Debt | $ 628,069 |
Net Leverage Ratio (Net Debt/Adjusted EBITDA for | 6.2x |
Schedule E – Balance Sheet | |||
December 31, | December 31, | ||
(in thousands) | (Unaudited) | ||
ASSETS | |||
Current assets: | |||
Cash and cash equivalents | $ 6,598 | $ 16,577 | |
Trade accounts receivable, net of allowance for doubtful accounts of $1,223 in | 53,520 | 43,837 | |
Inventories | 33,271 | 31,188 | |
Prepaid expenses and other current assets | 7,390 | 5,184 | |
Current assets associated with discontinued operations | — | 39 | |
Total current assets | 100,779 | 96,825 | |
Property, plant, and equipment: | |||
Land and building | 13,409 | 13,259 | |
Compressors and equipment | 1,072,927 | 975,375 | |
Vehicles | 8,469 | 7,692 | |
Construction in progress | 31,968 | 12,763 | |
Total property, plant, and equipment | 1,126,773 | 1,009,089 | |
Less accumulated depreciation | (556,311) | (457,688) | |
Net property, plant, and equipment | 570,462 | 551,401 | |
Other assets: | |||
Deferred tax asset | 5 | 10 | |
Intangible assets, net of accumulated amortization of $33,672 in 2021 and | 22,095 | 25,057 | |
Operating lease right-of-use assets | 25,898 | 32,637 | |
Other assets | 3,122 | 4,036 | |
Long-term assets associated with discontinued operations | — | — | |
Total other assets | 51,120 | 61,740 | |
Total assets | $ 722,361 | $ 709,966 | |
LIABILITIES AND PARTNERS' CAPITAL | |||
Current liabilities: | |||
Accounts payable | $ 28,958 | $ 19,766 | |
Unearned income | 2,187 | 269 | |
Accrued liabilities and other | 39,888 | 35,801 | |
Amounts payable to affiliates | — | 3,234 | |
Current liabilities associated with discontinued operations | 262 | 345 | |
Total current liabilities | 71,295 | 59,415 | |
Other liabilities: | |||
Long-term debt, net | 631,141 | 638,631 | |
Deferred tax liabilities | 819 | 1,478 | |
Long-term affiliate payable | — | — | |
Operating lease liabilities | 17,648 | 24,059 | |
Other long-term liabilities | 299 | 11,716 | |
Total other liabilities | 649,907 | 675,884 | |
Commitments and contingencies | |||
Partners' capital: | |||
General partner interest | 2,222 | (885) | |
Common units (140,386,811 units issued and outstanding at December 31, 2021 | 13,341 | (10,055) | |
Accumulated other comprehensive income (loss) | (14,404) | (14,393) | |
Total partners' capital | 1,159 | (25,333) | |
Total liabilities and partners' capital | $ 722,361 | $ 709,966 | |
SOURCE CSI Compressco LP

For further information: Jon Byers, CSI Compressco LP, The Woodlands, Texas, Phone: (281) 364-2279, jon.byers@csicompressco.com