

CSI Compressco LP Announces Strong Third Quarter Results And Updates Total Year Financial Guidance
THE WOODLANDS, Texas, Nov. 6, 2019 /PRNewswire/ -- CSI Compressco LP ("CSI Compressco") (NASDAQ: CCLP) announced third quarter 2019 revenue of $114 million and a net loss of $3.6 million. Distributable cash flow(1) improved 1% sequentially to $15.8 million while Adjusted EBITDA(1) increased 4% sequentially to $34.0 million as lower new equipment sales due to timing of shipments were more than offset by stronger compression services earnings. Adjusted EBITDA was the highest since the fourth quarter of 2014 as a result of achieving another quarter of record high compression service gross margins and equipment utilization.
![]()
Brady Murphy, President of CSI Compressco, commented, "The third quarter was yet another strong quarter for CSI Compressco with several financial and operational records being achieved. In a period of rapidly declining rig activity in the U.S., our business continues to deliver improved results underpinned by a long-term outlook of increasing U.S gas production. We continue to see improvements in Adjusted EBITDA driven by compression services margins, equipment utilization and aftermarket services. Adjusted EBITDA increased sequentially despite a $25 million decline in equipment sales due to the timing of shipments. This was the second quarter in a row during which we accomplished the highest Adjusted EBITDA since the fourth quarter of 2014."
"Compression Services business continues to benefit from incremental horsepower placed into service with our core customers in concentrated areas, which drives increased efficiency in servicing our fleet. Gross margins improved 50 basis points (bps) to 53.2% from 52.7% in the second quarter of 2019 and represents a record high since the acquisition of Compressor Systems, Inc. in 2014. This was the second quarter in a row during which we attained record high gross margins in compression services. Overall service fleet utilization increased 100 bps to 90.1% from the end of the second quarter of 2019, which was also another record high since the acquisition of Compressor Systems, Inc. Utilization for high horsepower equipment (greater than 1,000 horsepower per unit) increased 30 bps from the end of the second quarter, to 97.4%."
"Centralized gas lift continues to be an important application in high demand for equipment. Additionally, our increased focus on surface artificial lift for aging unconventional wells such as GAPL (gas assisted plunger lift) combined with BAIS (back side auto injection services) has resulted in a fourfold increase in the number of GasJack® units we have working in these applications since the beginning of the year. Recent case studies have highlighted our success in increasing oil and liquids production by as much as five to ten fold in these applications, resulting in multiple orders by customers in the Permian Basin and the SCOOP/STACK Basin. We are extremely pleased with the amount of interest and demand these new applications are creating for the GasJack units."
"We continue to work closely with our core customers in planning for their 2020 requirements and based on our forecast of a slightly slower pace of equipment requirements it is our intention to allocate more than 50% of our distributable cash flow to stakeholders and less than 50% to growth capital."
(1) These measures are not presented in accordance with generally accepted accounting principles in the United States ("GAAP"). Please see Schedules B, C and D for reconciliations of these non-GAAP financial measures to the most directly comparable GAAP measures. |
"Our aftermarket services business continues to increase with sequential revenue growth of 12%. Despite the sequential decline in our equipment revenue for our equipment sales business due to timing of shipments, we feel that this business will continue to stay strong. We completed the quarter with $29 million in net bookings for new equipment orders."
Unaudited results of operations for the quarter ended September 30, 2019 compared to the prior quarter and the corresponding prior year quarter are presented in the following tables.
Three Months Ended | |||||||||
Sep 30, 2019 | Jun 30, 2019 | Sep 30, 2018 | Q3-19 vs. | Q3-19 vs. | |||||
Net loss | $ (3,613) | $ (2,947) | $ (7,947) | (23) % | 55 % | ||||
Adjusted EBITDA(1) | $ 33,996 | $ 32,763 | $ 26,539 | 4 % | 28 % | ||||
Distributable cash flow(1) | $ 15,803 | $ 15,727 | $ 8,959 | 1 % | 78 % | ||||
Quarterly cash distribution per unit | $ 0.01 | $ 0.01 | $ 0.1875 | - % | (95)% | ||||
Distribution coverage ratio(1) | 33.13x | 32.97x | 1.07x | ||||||
Fleet growth capital expenditures(2) | $ 19,304 | $ 11,901 | $ 26,219 | 62 % | (26) % | ||||
Net cash provided by operating activities | $ 27,444 | $ 8,710 | $ 10,789 | 215 % | 154 % | ||||
Free cash flow(1) | $ 6,577 | $ (7,724) | $ (20,113) | 185 % | 133% | ||||
(1) Non-GAAP financial measures reconciled to the nearest GAAP number on Schedules B and C. | |||||||||
(2) Includes capital expenditures paid by TETRA Technologies, Inc. under $15 million backstop financing arrangement |
Compression and Related Services
As of September 30, 2019, aggregate service compressor fleet horsepower totaled 1,157,938 and the overall service fleet utilization rate was 90.1%, up 100 basis points from our exit utilization of 89.1% at June 30, 2019. During the third quarter we increased active operating service fleet horsepower by more than 14,300 horsepower. Total aggregate operating service fleet horsepower was 1,043,384 as of September 30, 2019 (we define the overall service fleet utilization rate as the aggregate service compressor fleet horsepower in service divided by the aggregate service compressor fleet horsepower as of such date). We do not exclude idle horsepower under repair from our calculation of these utilization rates. Since the beginning of the year we have added 70,923 horsepower at pricing that is generating approximately 20% returns on capital. We calculate returns on capital with regard to individual new compressor units by dividing estimated annual operating income generated by such compressor units by the initial cost of such compressor units.
Aftermarket Services and Equipment Sales
Aftermarket services revenue of $20.4 million increased $2.3 million sequentially as customer demand remains strong. We expect this business to end the year strong.
Given the timing of shipments and consistent with our expectations mentioned on our last earnings call, equipment sales in the third quarter were $28.4 million, down from $53.1 million in the second quarter of this year. Third quarter orders for new equipment sales were $29.0 million (net of cancellations), an increase over the $18.9 million in the second quarter of 2019. We received a large international order in the third quarter and expect to have one to two more large orders in the fourth quarter of 2019, or early in 2020. The pipeline of identified new unit sales opportunities remains in excess of $250 million, and while some of our customers have delayed committing to new orders this year, we continue to see a healthy outlook for this business.
2019 Guidance
Our full year 2019 guidance for revenue and Adjusted EBITDA remains unchanged at between $475 million and $490 million and between $125 million and $130 million, respectively. We now expect 2019 net loss to be between $19.5 million and $21.5 million, our average distribution coverage ratio for 2019 to be between 29X and 31X and 2019 distributable cash flow to be between $55 million and $59 million. Reconciliations of expected Adjusted EBITDA, distributable cash flow and distribution coverage ratio to the nearest GAAP financial measures are included on Schedule D.
We estimate 2019 capital expenditures to remain between $65 million to $70 million, which we expect to fund from cash on hand and cash flow from operations. This range includes $19 million to $21 million for maintenance capital expenditures and $46 million to $49 million of growth capital expenditures that are expected to add approximately 81,000 horsepower to the compression service fleet in 2019, all with client commitments. The range of growth capital expenditures excludes $14.6 million of compressor packages, with 20,700 horsepower, that TETRA Technologies, Inc. ("TETRA") agreed to purchase and lease to CSI Compressco. Year-to-date through September 2019, we invested approximately $53 million of capital expenditures, including maintenance capital expenditure and excluding the $14.6 million funded by TETRA. For financial reporting purposes, the $14.6 million of fleet additions funded by TETRA is reflected as CSI Compressco's capital expenditures. CSI Compressco has the right to buy the equipment from TETRA any time over the next five years in accordance with the terms of the agreements with TETRA and has no obligation to buy the equipment at the end of the five-year term. This support from TETRA will allow us to meet certain current client demands without having to further borrow under our asset-based revolver or access debt or equity markets.
Capital Allocation
On August 8, 2019 we completed the final cash redemption of the Series A Convertible Preferred Units, freeing up distributable cash flow to focus on creating equity value while meeting our core customer growth requirements. Of the $55 million to $59 million in distributable cash flow that we expect to generate in 2019, over $30 million was utilized to redeem the Series A Convertible Preferred Units, consistent with our press release on December 20, 2018. At the time of that announcement we indicated our plan was to (a) reduce the distribution to redeem the Series A Convertible Preferred Units in cash – which we have now accomplished and (b) to improve our leverage ratio to 4.5X – consistent with what was originally communicated at the May, 2018 investor conference we hosted in New York City. Since the end of the third quarter of 2018 our leverage ratio has improved significantly. Our goal remains to be below 4.5X by the end of 2020.
In the immediate quarters, distributable cash flow will be allocated to fabricating new service compression units to be deployed to our key customers where our investments are generating approximately 20% returns on capital. We expect to reduce our investments in growth capital in 2020 from the 2019 levels. Available distributable cash flow in 2020 after funding the reduced levels of growth capital will go to reducing debt as we continue to make progress towards our leverage ratio goal of 4.5X. As our leverage ratio improves, we believe that we create value to our equity holders and protect CSI Compressco during periods of market uncertainty. An improved leverage ratio should also better position us to refinance the unsecured senior notes that mature in August 2022.
Conference Call
CSI Compressco will host a conference call to discuss third quarter 2019 results today, November 6, 2019, at 10:30 a.m. Eastern Time. The phone number for the call is 1-866-374-8397. The conference will also be available by live audio webcast and may be accessed through CSI Compressco's website at www.csicompressco.com. An audio replay of the conference call will be available at 1-877-344-7529, conference number 10127841, for one week following the conference call and the archived webcast call will be available through the Company's website for 30 days following the conference call.
Third Quarter 2019 Cash Distribution on Common Units
On October 22, 2019, CSI Compressco announced that the board of directors of its general partner declared a cash distribution attributable to the third quarter of 2019 of $0.01 per outstanding common unit, which will be paid on November 14, 2019, to common unitholders of record as of the close of business on November 1, 2019. The distribution coverage ratio (which is a non-GAAP Financial Measure defined and reconciled to the closest GAAP financial measure on Schedule B below) for the third quarter of 2019 was 33.1X.
CSI Compressco Overview
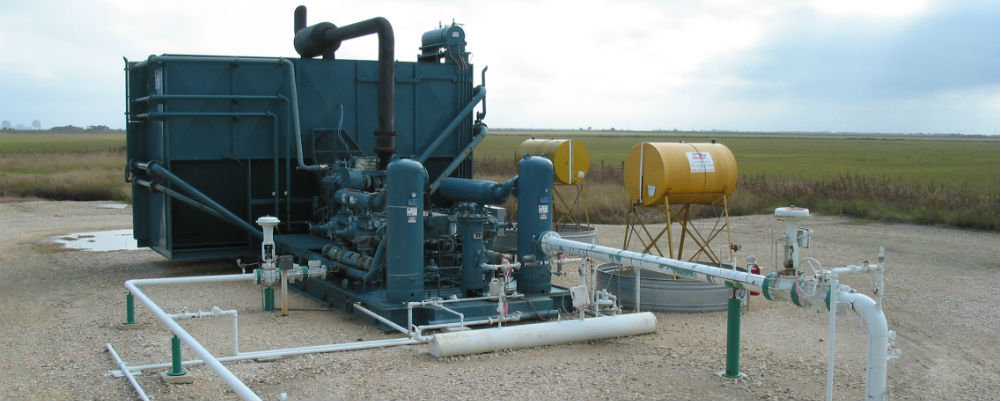
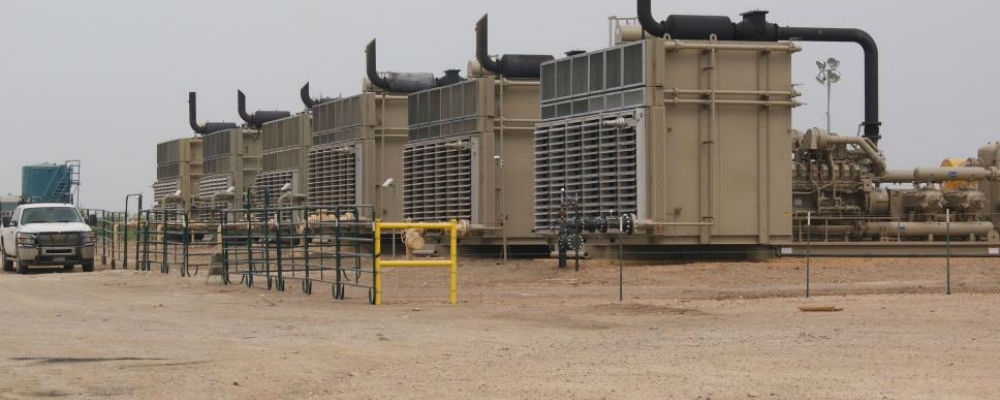
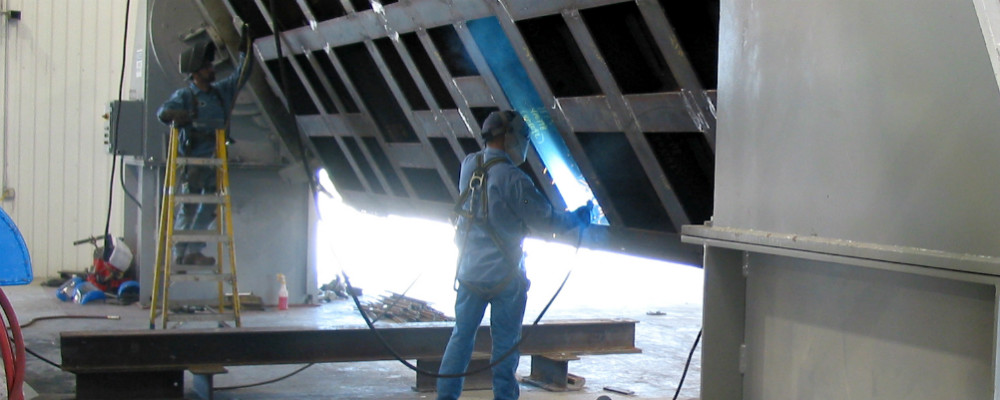
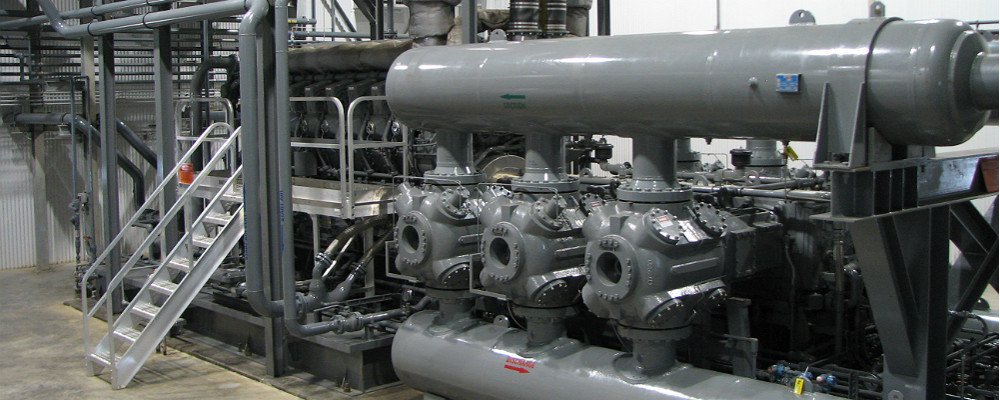
CSI Compressco is a provider of compression services and equipment for natural gas and oil production, gathering, transportation, processing, and storage. CSI Compressco's compression and related services business includes a fleet of more than 5,200 compressor packages providing approximately 1.16 million in aggregate horsepower, utilizing a full spectrum of low, medium and high horsepower engines. CSI Compressco also provides well monitoring and automated sand separation services in conjunction with compression and related services in Mexico. CSI Compressco's equipment sales business includes the fabrication and sale of standard compressor packages and custom-designed compressor packages designed and fabricated primarily at our facility in Midland, Texas. CSI Compressco's aftermarket services business provides compressor package reconfiguration and maintenance services, as well as the sale of compressor package parts and components manufactured by third-party suppliers. CSI Compressco's customers comprise a broad base of natural gas and oil exploration and production, mid-stream, transmission, and storage companies operating throughout many of the onshore producing regions of the United States, as well as in a number of foreign countries, including Mexico, Canada and Argentina. CSI Compressco is managed by CSI Compressco GP Inc., which is an indirect, wholly owned subsidiary of TETRA Technologies, Inc. (NYSE: TTI).
Forward-Looking Statements
This news release contains "forward-looking statements" and information based on our beliefs and those of our general partner, CSI Compressco GP Inc. Forward-looking statements in this news release are identifiable by the use of the following words and other similar words: "anticipates," "assumes," "believes," "budgets," "could," "estimates," "expectations," "expects," "forecasts," "goal," "intends," "may," "might," "plans," "predicts," "projects," "schedules," "seeks," "should," "targets," "will," and "would." These forward-looking statements include statements, other than statements of historical fact, concerning the recovery of the oil and gas industry and CSI Compressco's strategy, future operations, financial position, estimated revenues, negotiations with our bank lenders, projected costs, and other statements regarding CSI Compressco's beliefs, expectations, plans, prospects and other future events and performance. Such forward-looking statements reflect our current views with respect to future events and financial performance, and are based on assumptions that we believe to be reasonable, but such forward-looking statements are subject to numerous risks and uncertainties, including but not limited to: economic and operating conditions that are outside of our control, including the supply, demand and prices of crude oil and natural gas; the levels of competition we encounter; the activity levels of our customers; the availability of adequate sources of capital to us; our ability to comply with contractual obligations, including those under our financing arrangements; our operational performance; the loss of our management; risks related to acquisitions and our growth strategy; the availability of raw materials and labor at reasonable prices; risks related to our foreign operations; the effect and results of litigation, regulatory matters, settlements, audits, assessments, and contingencies; or potential material weaknesses in the future; information technology risks, including the risk of cyberattack; and other risks and uncertainties contained in our Annual Report on Form 10-K and our other filings with the U.S. Securities and Exchange Commission ("SEC"), which are available free of charge on the SEC website at www.sec.gov. The risks and uncertainties referred to above are generally beyond our ability to control and we cannot predict all the risks and uncertainties that could cause our actual results to differ from those indicated by the forward-looking statements. If any of these risks or uncertainties materialize, or if any of the underlying assumptions prove incorrect, actual results may vary from those indicated by the forward-looking statements, and such variances may be material. All subsequent written and verbal forward-looking statements made by or attributable to us or to persons acting on our behalf are expressly qualified in their entirety by reference to these risks and uncertainties. You should not place undue reliance on forward-looking statements. Each forward-looking statement speaks only as of the date of the particular statement, and we undertake no obligation to update or revise any forward-looking statements we may make, except as may be required by law.
Schedule A - Income Statement (unaudited)
| |||||||||
Results of Operations (unaudited) | Three Months Ended | Nine Months Ended | |||||||
Sep 30, 2019 | Jun 30, 2019 | Sep 30, 2018 | Sep 30, 2019 | Sep 30, 2018 | |||||
(in Thousands, Except per Unit Amounts) | |||||||||
Revenues: | |||||||||
Compression and related services | $ 64,957 | $ 64,546 | $ 58,869 | $ 192,535 | $ 169,313 | ||||
Aftermarket services | 20,426 | 18,169 | 19,869 | 52,196 | 48,979 | ||||
Equipment sales | 28,364 | 53,141 | 36,518 | 108,308 | 82,303 | ||||
Total revenues | 113,747 | 135,856 | 115,256 | 353,039 | 300,595 | ||||
Cost of revenues (excluding depreciation and amortization expense): | |||||||||
Cost of compression and related services | 30,395 | 30,520 | 31,074 | 93,536 | 92,963 | ||||
Cost of aftermarket services | 17,163 | 15,428 | 16,165 | 43,841 | 40,163 | ||||
Cost of equipment sales | 26,518 | 47,402 | 33,458 | 98,149 | 73,065 | ||||
Total cost of revenues | 74,076 | 93,350 | 80,697 | 235,528 | 206,191 | ||||
Depreciation and amortization | 18,459 | 19,054 | 17,681 | 56,045 | 52,496 | ||||
Impairments and other charges | 849 | 2,311 | - | 3,160 | - | ||||
Insurance recoveries | (325) | - | - | (325) | - | ||||
Selling, general, and administrative expense | 11,336 | 10,974 | 10,592 | 32,975 | 29,738 | ||||
Interest expense, net | 13,533 | 13,045 | 13,847 | 39,877 | 39,103 | ||||
Series A Preferred fair value adjustment | - | 166 | 570 | 1,470 | 1,537 | ||||
Other (income) expense, net | (205) | 607 | (78) | 21 | 2,748 | ||||
Income (loss) before income tax provision | (3,976) | (3,651) | (8,053) | (15,710) | (31,218) | ||||
Provision (benefit) for income taxes | (363) | (704) | (106) | 3,306 | 2,058 | ||||
Net income (loss) | $ (3,613) | $ (2,947) | $ (7,947) | $ (19,016) | $ (33,276) | ||||
Net income per diluted common unit | $ (0.08) | $ (0.06) | $ (0.18) | $ (0.40) | $ (0.81) | ||||
Reconciliation of Non-GAAP Financial Measures
The Partnership includes in this release the non-GAAP financial measures Adjusted EBITDA, distributable cash flow, distribution coverage ratio, and free cash flow. Adjusted EBITDA is used as a supplemental financial measure by the Partnership's management to:
- assess the Partnership's ability to generate available cash sufficient to make distributions to the Partnership's unitholders and general partner;
- evaluate the financial performance of its assets without regard to financing methods, capital structure or historical cost basis;
- measure operating performance and return on capital as compared to those of our competitors; and
- determine the Partnership's ability to incur and service debt and fund capital expenditures.
The Partnership defines Adjusted EBITDA as earnings before interest, taxes, depreciation and amortization, and before certain non-cash charges and other non-recurring or unusual expenses or charges, including impairments, equity compensation, bad debt expense attributable to bankruptcy of customer, non-cash costs of compressors sold, fair value adjustments of our Preferred Units, write-off of unamortized financing costs, and excluding Series A Convertible Preferred Unit redemption premiums, fair value adjustments and severance.
Distributable cash flow is used as a supplemental financial measure by the Partnership's management, as it provides important information relating to the relationship between our financial operating performance and our cash distribution capability. Additionally, the Partnership uses distributable cash flow in setting forward expectations and in communications with the board of directors of our general partner. The Partnership defines distributable cash flow as Adjusted EBITDA less current income tax expense, maintenance capital expenditures, interest expense, and severance expense, plus non-cash interest expense.
The Partnership believes that the distribution coverage ratio provides important information relating to the relationship between the Partnership's financial operating performance and its cash distribution capability. The Partnership defines the distribution coverage ratio as the ratio of distributable cash flow to the total quarterly distribution payable, which includes, as applicable, distributions payable on all outstanding common units, the general partner interest and the general partner's incentive distribution rights.
The Partnership defines free cash flow as net cash provided by operating activities less capital expenditures, net of sales proceeds. Management primarily uses this metric to assess our ability to retire debt, evaluate our capacity to further invest and grow, and measure our performance as compared to our peer group of companies.
These non-GAAP financial measures should not be considered an alternative to net income, operating income, cash flows from operating activities or any other measure of financial performance presented in accordance with GAAP. These non-GAAP financial measures may not be comparable to Adjusted EBITDA, gross margin, distributable cash flow, free cash flow or other similarly titled measures of other entities, as other entities may not calculate these non-GAAP financial measures in the same manner as CSI Compressco. Management compensates for the limitation of these non-GAAP financial measures as an analytical tool by reviewing the comparable GAAP measures, understanding the differences between the measures and incorporating this knowledge into management's decision-making process. Furthermore, these non-GAAP measures should not be viewed as indicative of the actual amount of cash that CSI Compressco has available for distributions or that the Partnership plans to distribute for a given period, nor should they be equated to available cash as defined in the Partnership's partnership agreement.
Schedule B - Reconciliation of Net Income/(Loss) to Adjusted EBITDA, Distributable Cash Flow and Distribution Coverage Ratio (unaudited)
The following table reconciles net income (loss) to Adjusted EBITDA, distributable cash flow and distribution coverage ratio for the three month periods ended September 30, 2019, June 30, 2019 and September 30, 2018 and nine month periods ended September 30, 2019 and September 30, 2018:
Three Months Ended | Nine Months Ended | ||||||||
Sep 30, 2019 | Jun 30, 2019 | Sep 30, 2018 | Sep 30, 2019 | Sep 30, 2018 | |||||
(In Thousands) | |||||||||
Net income (loss) | $ (3,613) | $ (2,947) | $ (7,947) | $ (19,016) | $ (33,276) | ||||
Interest expense, net | 13,533 | 13,045 | 13,847 | 39,877 | 39,103 | ||||
Provision for income taxes | (363) | (704) | (106) | 3,306 | 2,058 | ||||
Depreciation and amortization | 18,459 | 19,054 | 17,681 | 56,045 | 52,496 | ||||
Impairments and other charges | 849 | 2,464 | - | 3,313 | - | ||||
Bad debt expense attributable to bankruptcy of customer | 1,768 | - | - | 1,768 | - | ||||
Non-cash cost of compressors sold | 2,803 | 98 | 1,951 | 3,841 | 3,086 | ||||
Equity Compensation | (211) | 590 | 367 | 744 | 259 | ||||
Series A Preferred redemption premium | 399 | 621 | - | 1,468 | - | ||||
Series A Preferred fair value adjustments | - | 166 | 570 | 1,470 | 1,537 | ||||
Un-amortized financing cost charged to expense | - | - | - | - | 3,539 | ||||
Severance | 118 | - | - | 118 | 12 | ||||
Other | 254 | 376 | 176 | 630 | 176 | ||||
Adjusted EBITDA | $ 33,996 | $ 32,763 | $ 26,539 | $ 93,564 | $ 68,990 | ||||
Less: | |||||||||
Current income tax expense | 34 | (184) | 343 | 2,757 | 2,335 | ||||
Maintenance capital expenditures | 5,729 | 4,900 | 5,194 | 16,358 | 15,122 | ||||
Interest expense | 13,533 | 13,045 | 13,847 | 39,877 | 39,103 | ||||
Severance and other | 372 | 376 | 176 | 748 | 188 | ||||
Plus: | |||||||||
Non-cash interest expense | 1,475 | 1,101 | 1,980 | 4,004 | 6,838 | ||||
Distributable cash flow | 15,803 | 15,727 | 8,959 | 37,828 | 19,080 | ||||
Cash distribution attributable to period | 477 | 477 | 8,383 | 1,431 | 24,013 | ||||
Distribution coverage ratio | 33.13x | 32.97x | 1.07x | 26.43x | 0.79x | ||||
Schedule C - Reconciliation of Net Cash Provided by Operating Activities to Free Cash Flow (unaudited)
The following table reconciles net cash provided by operating activities to free cash flow for the three month periods ended September 30, 2019, June 30, 2019 and September 30, 2018 and nine month periods ended September 30, 2019 and September 30, 2018:
Results of Operations (unaudited) | Three Months Ended | Nine Months Ended | |||||||
Sep 30, 2019 | Jun 30, 2019 | Sep 30, 2018 | Sep 30, 2019 | Sep 30, 2018 | |||||
(In Thousands) | |||||||||
Net cash provided by operating activities | $ 27,444 | $ 8,710 | $ 10,789 | $ 67,786 | $ 6,516 | ||||
Capital expenditures, net of sales proceeds | (20,867) | (16,434) | (30,902) | (60,453) | (78,164) | ||||
Free cash flow | $ 6,577 | $ (7,724) | $ (20,113) | $ 7,333 | $ (71,648) | ||||
Schedule D - Reconciliation of Projected Net Income/(Loss) to Adjusted EBITDA, Distributable Cash Flow and Distribution Coverage Ratio (unaudited)
The following table reconciles a range of projected 2019 net income (loss) to projected 2019 Adjusted EBITDA and projected 2019 Distribution Coverage Ratio.
2019 Guidance | |||
(In Thousands) | |||
Low ($125M EBITDA) | High ($130M EBITDA) | ||
Net income (loss) | $ (21,467) | $ (19,467) | |
Interest expense, net | 52,000 | 53,000 | |
Provision for income taxes | 3,200 | 3,500 | |
Depreciation and amortization | 76,000 | 77,000 | |
Non-cash cost of compressors sold | 5,500 | 6,000 | |
Equity Compensation | 1,000 | 1,200 | |
Impairments and other charges | 3,313 | 3,313 | |
Unusual items (incl. Series A Issuance costs) | 5,454 | 5,454 | |
Adjusted EBITDA | $ 125,000 | $ 130,000 | |
Less: Current income tax expense | $ 3,200 | $ 3,500 | |
Less: Maintenance capital expenditures | 19,000 | 21,000 | |
Less: Interest Expense, net | 52,000 | 53,000 | |
Plus: Non-cash items included in interest expense | 4,000 | 6,000 | |
Distributable cash flow | $ 54,800 | $ 58,500 | |
Cash distribution attributable to period | $ 1,910 | $ 1,910 | |
Distribution coverage ratio | 28.69x | 30.63x | |
Schedule D common uses unit distributions in 2019 at $0.04 per common unit on an annualized basis, which was announced and approved earlier this year for final payment in November. |
SOURCE CSI Compressco LP

For further information: For further information: Elijio Serrano, CFO, CSI Compressco LP., The Woodlands, Texas, Phone: (281) 367-1983, www.csicompressco.com