


CSI Compressco LP Announces Second Quarter 2015 Results And Updates 2015 Guidance
CSI Compressco LP Announces Second Quarter 2015 Results And Updates 2015 Guidance
Highlights of the second quarter 2015 results include:
- Adjusted EBITDA of
$31.5 million , more than triple the second quarter of 2014 reflecting the benefit of the acquisition ofCompressor Systems, Inc. ("CSI").(1) - Equipment and Parts Sales of
$49.0 million , an increase of$30.8 million over first quarter 2015. - Record quarterly revenue of
$126.5 million . - A second quarter distribution that is 10% higher than the distribution announced for the second quarter of 2014. The 2015 second quarter distribution, with a 1.19x coverage ratio, is the eighth consecutive increase and the eleventh increase in the past twelve quarters.
- Quarter end compression fleet horsepower of 1,138,656 total and 952,442 utilized, representing net increases of 92,736 (9%) and 50,847 (6%) horsepower, respectively, over
June 30, 2014 on a pro forma basis.(2)
|
Quarter Ended |
2015 vs. 2014 |
|||||||||
|
June 30, 2015 |
June 30, 2014 |
|||||||||
|
(In Thousands, Except Ratios, and Percentages) |
||||||||||
|
Adjusted EBITDA(1) |
$ |
31,479 |
$ |
10,399 |
203 |
% |
||||
|
Distributable cash flow(1) |
$ |
20,568 |
$ |
9,378 |
119 |
% |
||||
|
Cash distribution per unit annualized |
$ |
2.00 |
$ |
1.81 |
10 |
% |
||||
|
Distribution coverage ratio(1) |
1.19x |
1.30x |
— |
|||||||
|
Fleet capital expenditures |
$ |
19,610 |
$ |
5,366 |
265 |
% |
||||
|
(1) |
Non-GAAP financial measures reconciled to the nearest GAAP number later in the release. |
|
(2) |
Pro forma combined for pre-acquisition CSI and Compressco Partners, L.P. |
Consolidated revenues and income before tax for the quarter ended
Compared to the first quarter of 2015, compression and related services revenues decreased
Unaudited results of operations for the three and six month periods ended
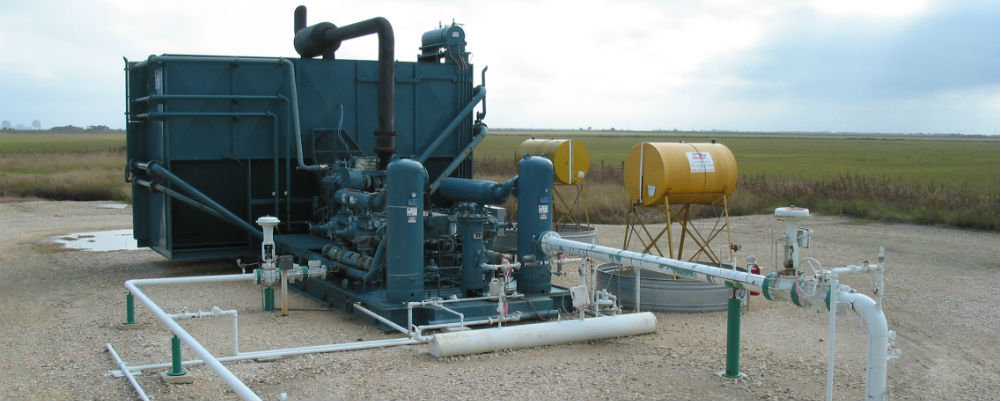
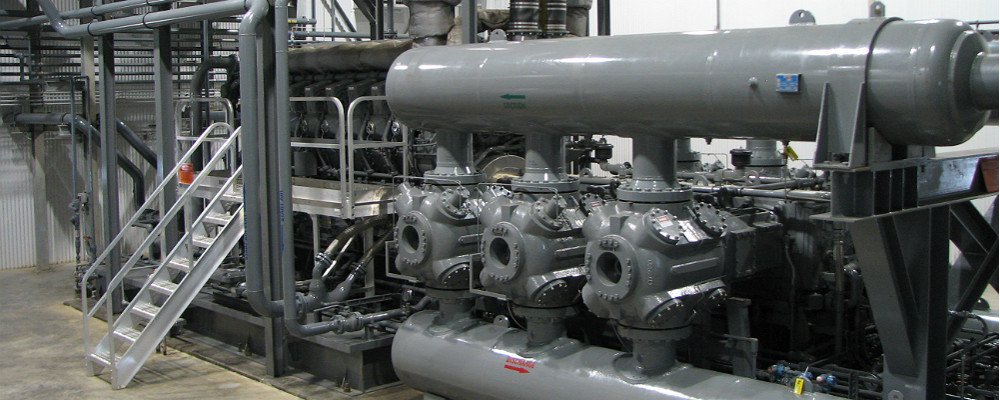
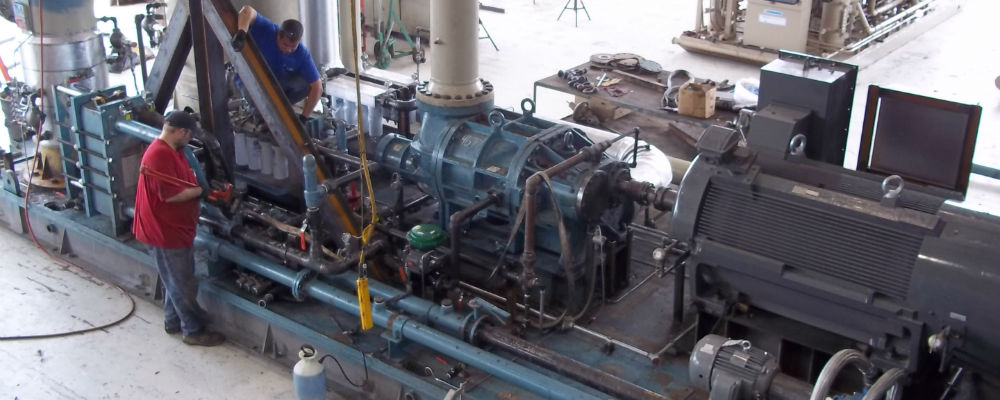
We are continuing to invest in the higher horsepower portion of our compression services fleet, which is targeted at gathering and midstream applications where we have higher current utilization and generally experience greater and more consistent demand as well as higher contribution margins.
Results through the second quarter give us confidence in our previous revenue guidance of
Second Quarter Distribution
On
Conference Call
CSI Compressco Overview
Forward Looking Statements
This press release contains "forward-looking statements" and information based on our beliefs and those of our general partner,
|
Results of operations (unaudited) |
|||||||||||||||
|
Three Months Ended |
Six Months Ended |
||||||||||||||
|
June 30, |
June 30, |
||||||||||||||
|
2015 |
2014 |
2015 |
2014 |
||||||||||||
|
(In Thousands, Except per Unit Amounts) |
|||||||||||||||
|
Revenues |
|||||||||||||||
|
Compression and related services |
$ |
72,826 |
$ |
30,043 |
$ |
148,114 |
$ |
57,970 |
|||||||
|
Aftermarket services |
4,671 |
— |
14,121 |
— |
|||||||||||
|
Equipment and parts sales |
48,968 |
2,065 |
67,119 |
3,948 |
|||||||||||
|
Total revenues |
126,465 |
32,108 |
229,354 |
61,918 |
|||||||||||
|
Cost of revenues (excluding depreciation and amortization) |
|||||||||||||||
|
Cost of compression and related services |
37,490 |
16,227 |
74,468 |
31,381 |
|||||||||||
|
Cost of aftermarket services |
4,195 |
— |
12,367 |
— |
|||||||||||
|
Cost of equipment and parts sales |
43,000 |
1,066 |
57,957 |
1,995 |
|||||||||||
|
Total cost of revenues |
84,685 |
17,293 |
144,792 |
33,376 |
|||||||||||
|
Selling, general, and administrative expense |
10,554 |
5,008 |
21,803 |
9,102 |
|||||||||||
|
Depreciation and amortization |
20,629 |
3,751 |
40,617 |
7,433 |
|||||||||||
|
Interest expense, net |
7,961 |
145 |
15,867 |
304 |
|||||||||||
|
Other (income) expense, net |
1,170 |
498 |
2,409 |
1,037 |
|||||||||||
|
Income before tax provision |
1,466 |
5,413 |
3,866 |
10,666 |
|||||||||||
|
Provision for income taxes |
303 |
534 |
895 |
1,168 |
|||||||||||
|
Net income |
$ |
1,163 |
$ |
4,879 |
$ |
2,971 |
$ |
9,498 |
|||||||
|
Net income per diluted common unit |
$ |
0.02 |
$ |
0.30 |
$ |
0.07 |
$ |
0.59 |
|||||||
Reconciliation of Non-GAAP Financial Measures
The Partnership includes in this release the non-GAAP financial measures EBITDA, Adjusted EBITDA, distributable cash flow and distribution coverage ratio. EBITDA and Adjusted EBITDA are used as supplemental financial measures by the Partnership's management to:
- assess the Partnership's ability to generate available cash sufficient to make distributions to the Partnership's unitholders and general partner;
- evaluate the financial performance of the Partnership's assets without regard to financing methods, capital structure or historical cost basis;
- measure operating performance and return on capital as compared to those of our competitors; and
- determine the Partnership's ability to incur and service debt and fund capital expenditures.
The Partnership defines EBITDA as earnings before interest, taxes, depreciation and amortization. Adjusted EBITDA is defined as EBITDA excluding equity compensation, CSI related transaction costs, and amortized finance costs.
Distributable cash flow is used as a supplemental financial measure by the Partnership's management as it provides important information relating to the relationship between our financial operating performance and our cash distribution capability. Additionally, the Partnership uses distributable cash flow in setting forward expectations and in communications with the board of directors of our general partner. The Partnership defines distributable cash flow as EBITDA less current income tax expense, maintenance capital expenditures, and interest expense, plus the non-cash cost of compressors sold, non-cash charges and losses that are unusual or non-recurring, and equity compensation expense. The Partnership believes that the distribution coverage ratio provides important information relating to the relationship between the Partnership's financial operating performance and its cash distribution capability. The Partnership defines the distribution coverage ratio as the ratio of distributable cash flow to the total quarterly distribution payable, which includes, as applicable, distributions payable on all outstanding common and subordinated units, the general partner interest, and the general partner's incentive distribution rights.
These non-GAAP financial measures should not be considered alternatives to net income, operating income, cash flows from operating activities or any other measure of financial performance presented in accordance with GAAP. These non-GAAP financial measures may not be comparable to EBITDA, Adjusted EBITDA, distributable cash flow or other similarly titled measures of other entities, as other entities may not calculate these non-GAAP financial measures in the same manner as the Partnership. Management compensates for the limitation of these non-GAAP financial measures as an analytical tool by reviewing the comparable GAAP measures, understanding the differences between the measures and incorporating this knowledge into management's decision making process. Furthermore, these non-GAAP measures should not be viewed as indicative of the actual amount of cash that the Partnership has available for distributions or that the Partnership plans to distribute for a given period, nor should they be equated to available cash as defined in the Partnership's partnership agreement.
The following table reconciles net income to EBITDA for the three and six month periods ended
|
Three Months Ended |
Six Months Ended |
||||||||||||||
|
June 30, |
June 30, |
||||||||||||||
|
2015 |
2014 |
2015 |
2014 |
||||||||||||
|
(In Thousands) |
|||||||||||||||
|
Net income |
$ |
1,163 |
$ |
4,879 |
$ |
2,971 |
$ |
9,498 |
|||||||
|
Provision for income taxes |
303 |
534 |
895 |
1,168 |
|||||||||||
|
Depreciation and amortization |
20,629 |
3,751 |
40,617 |
7,433 |
|||||||||||
|
Interest expense, net |
7,961 |
145 |
15,867 |
304 |
|||||||||||
|
EBITDA |
$ |
30,056 |
$ |
9,309 |
$ |
60,350 |
$ |
18,403 |
|||||||
The following table reconciles EBITDA to Adjusted EBITDA for the three and six month periods ended
|
Three Months Ended |
Six Months Ended |
||||||||||||||
|
June 30, |
June 30, |
||||||||||||||
|
2015 |
2014 |
2015 |
2014 |
||||||||||||
|
(In Thousands) |
|||||||||||||||
|
EBITDA |
$ |
30,056 |
$ |
9,309 |
$ |
60,350 |
$ |
18,403 |
|||||||
|
Equity compensation |
727 |
235 |
1,204 |
437 |
|||||||||||
|
Amortized finance costs |
696 |
— |
1,392 |
— |
|||||||||||
|
CSI transaction costs |
— |
855 |
208 |
855 |
|||||||||||
|
Adjusted EBITDA |
$ |
31,479 |
$ |
10,399 |
$ |
63,154 |
$ |
19,695 |
|||||||
|
CSI transaction related costs in SG&A |
$ |
— |
$ |
855 |
$ |
208 |
$ |
855 |
|||||||
The following table reconciles net income to distributable cash flow and distribution coverage ratio for the three and six month periods ended
|
Three Months Ended |
Six Months Ended |
||||||||||||||
|
June 30, |
June 30, |
||||||||||||||
|
2015 |
2014 |
2015 |
2014 |
||||||||||||
|
(In Thousands, Except Ratio) |
|||||||||||||||
|
Net income |
$ |
1,163 |
$ |
4,879 |
$ |
2,971 |
$ |
9,498 |
|||||||
|
Provision for income taxes |
303 |
534 |
895 |
1,168 |
|||||||||||
|
Depreciation and amortization |
20,629 |
3,751 |
40,617 |
7,433 |
|||||||||||
|
Interest expense, net |
7,961 |
145 |
15,867 |
304 |
|||||||||||
|
EBITDA |
30,056 |
9,309 |
60,350 |
18,403 |
|||||||||||
|
Less: |
|||||||||||||||
|
Current income tax expense |
917 |
742 |
1,329 |
1,309 |
|||||||||||
|
Maintenance capital expenditures |
2,033 |
201 |
4,204 |
241 |
|||||||||||
|
Interest expense |
7,961 |
145 |
15,867 |
304 |
|||||||||||
|
Plus: |
|||||||||||||||
|
Non-cash cost of compressors sold |
— |
67 |
206 |
67 |
|||||||||||
|
Equity compensation |
727 |
235 |
1,204 |
437 |
|||||||||||
|
Amortization of finance costs |
696 |
— |
1,392 |
— |
|||||||||||
|
CSI transaction related expenses |
— |
855 |
208 |
855 |
|||||||||||
|
Distributable cash flow |
$ |
20,568 |
$ |
9,378 |
$ |
41,960 |
$ |
17,908 |
|||||||
|
Cash distribution attributable to period |
$ |
17,293 |
$ |
7,205 |
$ |
34,391 |
$ |
14,267 |
|||||||
|
Distribution coverage ratio |
1.19x |
1.30x |
1.22x |
1.26x |
|||||||||||
To view the original version on PR Newswire, visit:http://www.prnewswire.com/news-releases/csi-compressco-lp-announces-second-quarter-2015-results-and-updates-2015-guidance-300124636.html
SOURCE
CSI Compressco LP, Midland, Texas, Shari Mattern, Investor Relations, 432/296-5977, www.csicompressco.com