

CSI Compressco LP Announces Second Quarter 2016 Results
CSI Compressco LP Announces Second Quarter 2016 Results
- Second quarter net loss of
$4.7 million - Second quarter Adjusted EBITDA(1) of
$24.8 million - Second quarter net cash provided from operating activities of
$20.5 million - Second quarter free cash flow(1) of
$18.0 million - Second quarter cash distribution of
$0.3775 per unit - Second quarter distribution coverage ratio(1) of 1.19x
- Continued reduction in SGA expenditures
|
June 30, 2016 |
June 30, 2016 |
||||||||||||||||
|
Three Months Ended |
vs. |
vs. |
|||||||||||||||
|
June 30, 2016 |
March 31, 2016 |
June 30, 2015 |
March 31, 2016 |
June 30, 2015 |
|||||||||||||
|
(In Thousands, Except Ratios, and Percentages) |
|||||||||||||||||
|
Net income (loss) |
$ |
(4,680) |
$ |
(105,349) |
$ |
1,163 |
96 % |
(502)% |
|||||||||
|
Adjusted EBITDA(1) |
$ |
24,799 |
$ |
25,442 |
$ |
31,525 |
(3)% |
(21)% |
|||||||||
|
Distributable cash flow(1) |
$ |
15,207 |
$ |
14,232 |
$ |
20,568 |
7 % |
(26)% |
|||||||||
|
Cash distribution per unit annualized |
$ |
1.51 |
$ |
1.51 |
$ |
2.00 |
— |
(25)% |
|||||||||
|
Distribution coverage ratio(1) |
1.19x |
1.11x |
1.19x |
— |
— |
||||||||||||
|
Fleet capital expenditures |
$ |
8 |
$ |
436 |
$ |
19,610 |
(98)% |
(100)% |
|||||||||
|
Net cash provided by operating activities |
$ |
20,469 |
$ |
15,095 |
$ |
19,721 |
36 % |
4 % |
|||||||||
|
Free cash flow(1) |
$ |
18,016 |
$ |
13,742 |
$ |
(213) |
31 % |
— |
|||||||||
|
(1) |
Adjusted EBITDA, distributable cash flow, distribution coverage ratio, and free cash flow are non-GAAP financial measures that are defined and reconciled to the nearest GAAP financial measure on Schedules B and C in this press release. |
Consolidated revenues for the quarter ended
As of
Unaudited results of operations for the three month period ended
"In the second quarter of 2016 we entered into an amendment of our senior secured credit agreement which increases the maximum leverage ratio to 5.50x through the third quarter of 2016, then increasing to 5.75x through third quarter 2017, with additional step-downs following. This proactive measures addresses leverage concerns, and is one of many actions taken in dealing with the continued impact of the prolonged downturn. As of
"Our total capital expenditure forecast for 2016 remains between
Conference Call
Second Quarter 2016 Distribution
On
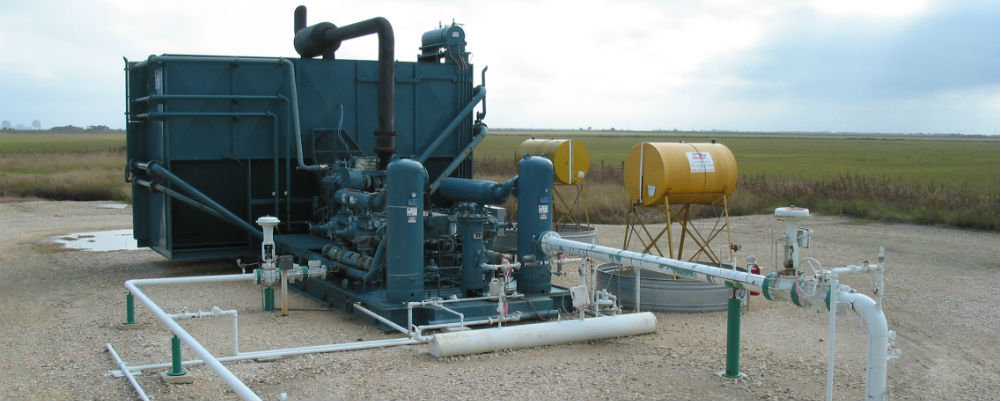
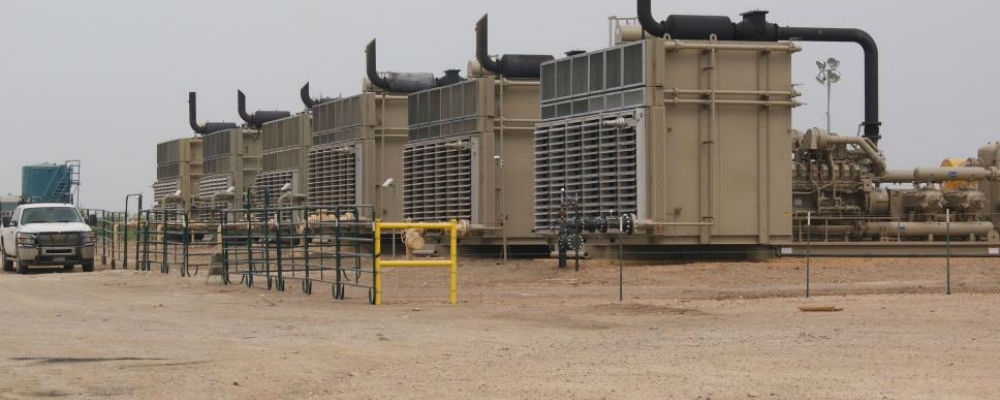
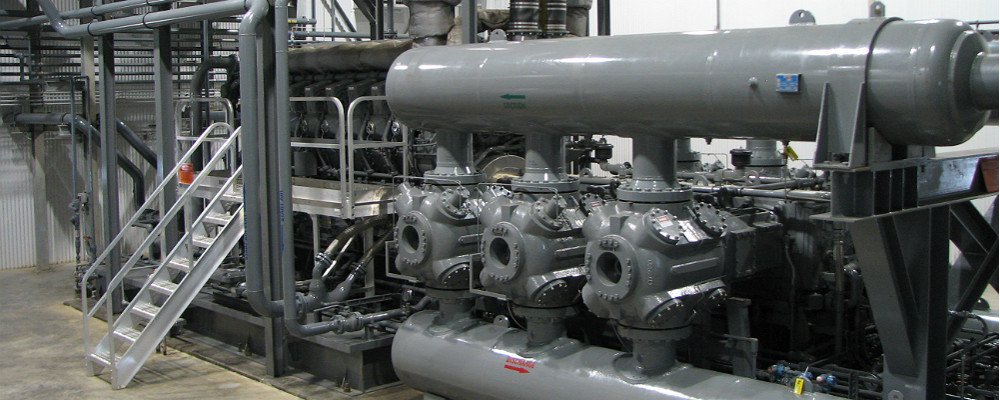
CSI Compressco Overview
Forward Looking Statements
This press release contains "forward-looking statements" and information based on our beliefs and those of our general partner,
|
Schedule A - Income Statement |
|||||||||||||||||||
|
Results of Operations (unaudited) |
|||||||||||||||||||
|
Three Months Ended |
Six Months Ended |
||||||||||||||||||
|
June 30, 2016 |
March 31, 2016 |
June 30, 2015 |
June 30, 2016 |
June 30, 2015 |
|||||||||||||||
|
(In Thousands, Except per Unit Amounts) |
|||||||||||||||||||
|
Revenues: |
|||||||||||||||||||
|
Compression and related services |
$ |
57,827 |
$ |
62,411 |
$ |
72,826 |
$ |
120,238 |
$ |
148,114 |
|||||||||
|
Aftermarket services |
9,530 |
8,587 |
9,070 |
18,117 |
23,323 |
||||||||||||||
|
Equipment sales |
8,732 |
10,694 |
44,569 |
19,426 |
57,917 |
||||||||||||||
|
Total revenues |
$ |
76,089 |
$ |
81,692 |
$ |
126,465 |
$ |
157,781 |
$ |
229,354 |
|||||||||
|
Cost of revenues (excluding depreciation and amortization expense): |
|||||||||||||||||||
|
Cost of compression and related services |
$ |
29,760 |
$ |
31,805 |
$ |
37,490 |
$ |
61,565 |
$ |
74,468 |
|||||||||
|
Cost of aftermarket services |
7,279 |
6,618 |
7,184 |
13,897 |
19,063 |
||||||||||||||
|
Cost of equipment sales |
6,624 |
9,953 |
40,011 |
16,577 |
51,261 |
||||||||||||||
|
Total cost of revenues |
$ |
43,663 |
$ |
48,376 |
$ |
84,685 |
$ |
92,039 |
$ |
144,792 |
|||||||||
|
Depreciation and amortization |
18,742 |
18,452 |
20,629 |
37,194 |
40,617 |
||||||||||||||
|
Impairments of long-lived assets |
— |
7,866 |
— |
7,866 |
— |
||||||||||||||
|
Selling, general, and administrative expense |
8,183 |
10,230 |
10,554 |
18,413 |
21,803 |
||||||||||||||
|
Goodwill Impairment |
— |
92,334 |
— |
92,334 |
— |
||||||||||||||
|
Interest expense, net |
8,870 |
8,802 |
8,658 |
17,672 |
17,260 |
||||||||||||||
|
Other expense, net |
707 |
288 |
473 |
995 |
1,016 |
||||||||||||||
|
Income (loss) before income tax provision |
$ |
(4,076) |
$ |
(104,656) |
$ |
1,466 |
$ |
(108,732) |
$ |
3,866 |
|||||||||
|
Provision (benefit) for income taxes |
604 |
693 |
303 |
1,297 |
895 |
||||||||||||||
|
Net income (loss) |
$ |
(4,680) |
$ |
(105,349) |
$ |
1,163 |
$ |
(110,029) |
$ |
2,971 |
|||||||||
|
Net income (loss) per diluted common unit |
$ |
(0.14) |
$ |
(3.11) |
$ |
0.02 |
$ |
(3.28) |
$ |
0.07 |
|||||||||
Reconciliation of Non-GAAP Financial Measures
The Partnership includes in this release the non-GAAP financial measures Adjusted EBITDA, Adjusted EBITDA as calculated for financial covenant purposes, distributable cash flow, distribution coverage ratio, and free cash flow. Adjusted EBITDA and Adjusted EBITDA as calculated for financial covenant purposes are used as supplemental financial measures by the Partnership's management to:
- assess the Partnership's ability to generate available cash sufficient to make distributions to the Partnership's unitholders and general partner;
- evaluate the financial performance of its assets without regard to financing methods, capital structure or historical cost basis;
- measure operating performance and return on capital as compared to those of our competitors;
- determine the Partnership's ability to incur and service debt and fund capital expenditures; and
- monitor the financial performance measure used in the Partnership's bank credit facility financial covenant.
The Partnership defines Adjusted EBITDA as earnings before interest, taxes, depreciation and amortization, and before non-cash charges for impairments and non-cash costs of compressors sold, and excluding equity compensation, transaction costs, and severance expense.
The Partnership defines Adjusted EBITDA as calculated for financial covenant purposes as Adjusted EBITDA plus provision for doubtful accounts and other adjustments provided for in our credit facility definition of Consolidated EBITDA. This non-GAAP measure is only presented for the current quarterly period because Adjusted EBITDA for other periods referenced in this report has approximated Adjusted EBIDTA as calculated for financial covenant purposes.
Distributable cash flow is used as a supplemental financial measure by the Partnership's management as it provides important information relating to the relationship between our financial operating performance and our cash distribution capability. Additionally, the Partnership uses distributable cash flow in setting forward expectations and in communications with the board of directors of our general partner. The Partnership defines distributable cash flow as Adjusted EBITDA less current income tax expense, maintenance capital expenditures, interest expense, and severance expense, plus amortization of finance costs.
The Partnership believes that the distribution coverage ratio provides important information relating to the relationship between the Partnership's financial operating performance and its cash distribution capability. The Partnership defines the distribution coverage ratio as the ratio of distributable cash flow to the total quarterly distribution payable, which includes, as applicable, distributions payable on all outstanding common units, the general partner interest, and the general partner's incentive distribution rights.
The Partnership defines free cash flow as net cash provided by operating activities less capital expenditures, net of sales proceeds. Management primarily uses this metric to assess our ability to retire debt, evaluate our capacity to further invest and grow, and measure our performance as compared to our peer group of companies.
These non-GAAP financial measures should not be considered an alternative to net income, operating income, cash flows from operating activities or any other measure of financial performance presented in accordance with GAAP. These non-GAAP financial measures may not be comparable to Adjusted EBITDA, distributable cash flow, free cash flow or other similarly titled measures of other entities, as other entities may not calculate these non-GAAP financial measures in the same manner as
The following table reconciles net income (loss) to Adjusted EBITDA, distributable cash flow and distribution coverage ratio for the three month periods ended
|
Schedule B – Reconciliation of Net Income to Adjusted EBITDA, Distributable Cash Flow and Distribution Coverage Ratio |
|||||||||||||||||||
|
Results of Operations (unaudited) |
|||||||||||||||||||
|
Three Months Ended |
Six Months Ended |
||||||||||||||||||
|
June 30, 2016 |
March 31, 2016 |
June 30, 2015 |
June 30, 2016 |
June 30, 2015 |
|||||||||||||||
|
(In Thousands) |
|||||||||||||||||||
|
Net income (loss) |
$ |
(4,680) |
$ |
(105,349) |
$ |
1,163 |
$ |
(110,029) |
$ |
2,971 |
|||||||||
|
Interest expense, net |
8,870 |
8,802 |
8,658 |
17,672 |
17,260 |
||||||||||||||
|
Provision for income taxes |
604 |
693 |
303 |
1,297 |
895 |
||||||||||||||
|
Depreciation and amortization |
18,742 |
18,452 |
20,629 |
37,194 |
40,617 |
||||||||||||||
|
Impairments of long-lived assets |
— |
7,866 |
— |
7,866 |
— |
||||||||||||||
|
Goodwill impairment |
— |
92,334 |
— |
92,334 |
— |
||||||||||||||
|
Non-cash cost of compressors sold |
176 |
1,765 |
— |
1,941 |
206 |
||||||||||||||
|
Equity compensation |
825 |
636 |
727 |
1,461 |
1,204 |
||||||||||||||
|
CSI acquisition costs |
— |
— |
— |
— |
208 |
||||||||||||||
|
Severance |
262 |
243 |
45 |
505 |
244 |
||||||||||||||
|
Adjusted EBITDA(1) |
$ |
24,799 |
$ |
25,442 |
$ |
31,525 |
$ |
50,241 |
$ |
63,605 |
|||||||||
|
Less: |
|||||||||||||||||||
|
Current income tax expense |
421 |
548 |
917 |
969 |
1,329 |
||||||||||||||
|
Maintenance capital expenditures |
1,435 |
2,313 |
2,033 |
3,748 |
4,204 |
||||||||||||||
|
Interest expense |
8,870 |
8,802 |
8,658 |
17,672 |
17,260 |
||||||||||||||
|
Severance |
262 |
243 |
45 |
505 |
244 |
||||||||||||||
|
Plus: |
|||||||||||||||||||
|
Amortization of finance costs included in interest expense |
1,396 |
696 |
696 |
2,092 |
1,392 |
||||||||||||||
|
Distributable cash flow |
$ |
15,207 |
$ |
14,232 |
$ |
20,568 |
$ |
29,439 |
$ |
41,960 |
|||||||||
|
Cash distribution attributable to period |
$ |
12,784 |
$ |
12,784 |
$ |
17,293 |
$ |
25,568 |
$ |
34,391 |
|||||||||
|
Distribution coverage ratio |
1.19x |
1.11x |
1.19x |
1.15x |
1.22x |
||||||||||||||
|
(1) Adjusted EBITDA as calculated for financial covenant purposes is reconciled to Adjusted EBITDA as follows; |
|||||||||||||||||||
|
Adjusted EBITDA |
$ |
24,799 |
|||||||||||||||||
|
Provision for doubtful accounts and other adjustments provided for in Credit Facility definition of Consolidated EBITDA |
1,956 |
||||||||||||||||||
|
Adjusted EBITDA as calculated for financial covenants |
$ |
26,755 |
|||||||||||||||||
The following table reconciles cash from operations to free cash flow for the three month periods ended
|
Schedule C – Reconciliation of Net Cash Provided by Operating Activities Operations to Free Cash Flow |
|||||||||||||||||||
|
Results of Operations (unaudited) |
|||||||||||||||||||
|
Three Months Ended |
Six Months Ended |
||||||||||||||||||
|
June 30, 2016 |
March 31, 2016 |
June 30, 2015 |
June 30, 2016 |
June 30, 2015 |
|||||||||||||||
|
(In Thousands) |
|||||||||||||||||||
|
Net cash provided by operating activities |
$ |
20,469 |
$ |
15,095 |
$ |
19,721 |
$ |
35,564 |
$ |
52,202 |
|||||||||
|
Capital expenditures, net of sales proceeds |
(2,453) |
(1,353) |
(19,934) |
(3,806) |
(57,092) |
||||||||||||||
|
Free cash flow |
$ |
18,016 |
$ |
13,742 |
$ |
(213) |
$ |
31,758 |
$ |
(4,890) |
|||||||||
To view the original version on PR Newswire, visit:http://www.prnewswire.com/news-releases/csi-compressco-lp-announces-second-quarter-2016-results-300309733.html
SOURCE
CSI Compressco LP, Midland, Texas, Timothy A. Knox, 432/563-1170, Fax: 432/561-9732, www.csicompressco.co