

CSI Compressco LP Announces Third Quarter 2020 Results
THE WOODLANDS, Texas, Nov. 2, 2020 /PRNewswire/ -- CSI Compressco LP ("CSI Compressco" or the "Partnership") (NASDAQ: CCLP) today announced third quarter 2020 results.
![]()
Net loss for the third quarter ended September 30, 2020 was $12.6 million, inclusive of $0.8 million of non-recurring charges. This compares to a net loss of $24.6 million, in the second quarter of 2020, which included $15.8 million of non-recurring charges. Revenues for the quarter ended September 30, 2020 were $79 million, a decrease of 18% from the second quarter of 2020 driven by lower equipment sales following the closure of our fabrication operations. Adjusted EBITDA in the third quarter was $27.8 million (35.1% of revenue) compared to $27.0 million (28.1% of revenue) in the second quarter of 2020. Adjusted EBITDA in the third quarter included the benefit of $5.0 million from the sale of used equipment.
Third Quarter 2020
Brady Murphy, President of CSI Compressco commented, "Despite the industry macro environment with another 36% sequential decline in drilling rigs in the U.S., our business continues to perform very well. Excluding New Equipment Sales, which we are exiting, revenue decreased 1% to $72.3 million in the third quarter of 2020. Adjusted EBITDA improved by $722,000 and Adjusted EBITDA margins improved by 700 basis points. Contributing to our improved Adjusted EBITDA margins was the sale of some lower horsepower used unit sales as we continue to rationalize the fleet and upgrade to larger horsepower, and from continued efforts on cost reductions and streamlining our operations."
"As part of our exit of the New Equipment Sales business, our Midland, Texas fabrication facility and real estate was sold in early July for $17 million in gross cash proceeds. We also completed or expect to complete during the third and fourth quarters of this year the sale of used compressors in three separate transactions for a total of $13 million. We expect these sales of non-strategic and under-utilized assets may generate, in aggregate, incremental liquidity totaling approximately $30 million, $21 million of which was generated in the third quarter."
"As a key part of our strategy going forward, I am very pleased to announce the introduction of our new HelixTM digitally enhanced compression telemetry system. The Helix digitally enhanced compression system communicates at significantly higher fidelity rates, streaming data 1,440 times faster than our current telemetry solution. Our new telemetry system will leapfrog existing compression industry systems and allow the use of big data to improve performance, reliability and predictive maintenance. As part of our Helix digitally enhanced compression development, we are pleased to be the only oilfield services company to partner with Houston's Rice University D2K program, a partnership specifically designed to analyze big data and develop machine learning models that enhance our current predictive maintenance programs. Currently we have completed 25% of the hardware upgrade roll outs and expect to be fully deployed by the end of 2021."
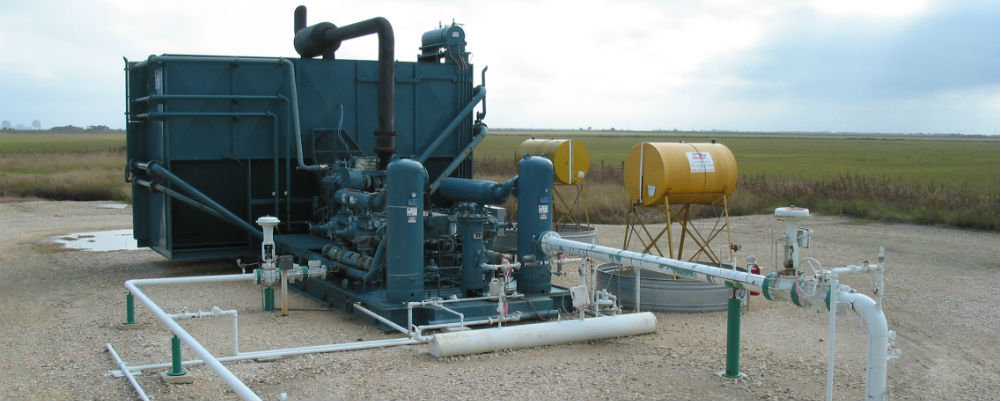
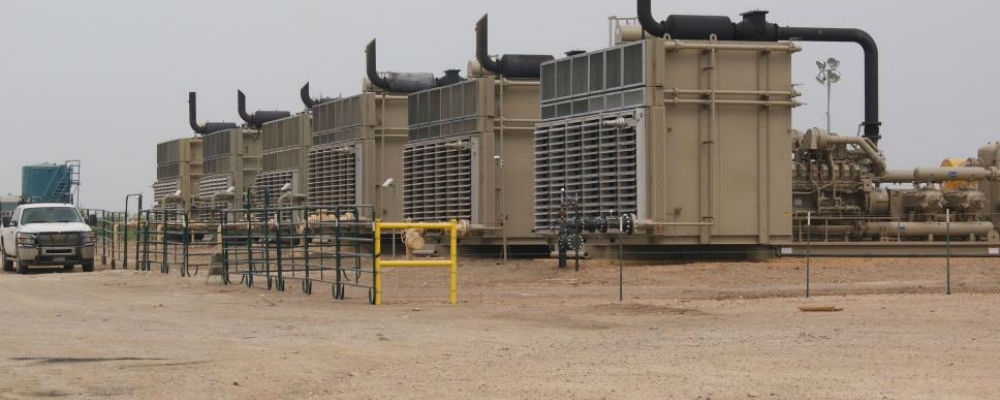
Compression Services revenue declined 5% sequentially while gross margins decreased 200 basis points to 52.9% in third quarter due to the full impact from pricing discounts and lower utilization. Utilization decreased from 82.1% at the end of June 2020 to 80.3% at the end of September 2020. We believe our strategy to invest in higher horsepower equipment will allow us to maintain utilization rates above the low point of the last downturn, which was 75.2% in the third quarter of 2016. Equipment on standby improved significantly from a peak of 226,000 horsepower in May of this year (approximately 20% of our fleet), to 78,000 horsepower at the end of September 2020 (approximately 8% of our fleet) as our customers started bringing production and units back online. We believe that production enhancement strategies on existing wells are becoming a greater priority for producers as the natural gas pricing outlook improves and producers focus on maximizing return on assets and free cash flow amidst the back drop of capital discipline. Compression is a low operating cost solution which allows producers to increase liquids and gas production when integrated with their artificial lift strategies. With regards to pricing, being a strategic compression service provider to our top three customers allowed us to stabilize pricing discounts to high single digits.
Aftermarket Services revenue declined 12% sequentially while gross margins improved 20 basis points to 14.8%. Aftermarket Services is expected to gain momentum in 2021 as deferred maintenance from 2020 is caught up. We are pleased to announce that we have secured Master Service Agreement with one large midstream provider for the provision of parts and services, representing immediate revenue generating opportunities that expand into 2021 and beyond. Equipment sales revenue decreased from $24.3 million in the second quarter to $11.9 million in the third quarter as we monetized some of the last new equipment orders out of backlog, as we exit the fabrication business. Our final shipments will be in the fourth quarter of this year. We sold $5.0 million of used equipment in the third quarter as we continue to monetize smaller under-utilized units.
Cash flow from operations was a net use of cash of $4.5 million in the third quarter, compared to positive cash generated of $4.8 million in the second quarter. Distributable cash flow in the third quarter was $10.5 million, up 25% from the second quarter of 2020, resulting in a distribution coverage ratio of 21.9x.
This press release includes the following financial measures that are not presented in accordance with generally accepted accounting principles in the United States ("U.S. GAAP"): Adjusted EBITDA, Adjusted EBITDA Margin, distributable cash flow, distribution coverage ratio, free cash flow, and net leverage ratio. Please see Schedules B-E for reconciliations of these non-GAAP financial measures to the most directly comparable U.S. GAAP measures.
Unaudited results of operations for the quarter ended September 30, 2020 compared to the prior quarter and the corresponding prior year quarter are presented in the table below.
Three Months Ended | |||||||||||||||||
Sep 30, 2020 | Jun 30, 2020 | Sep 30, 2019 | Q3-2020 v Q2- | Q3-2020 v Q3- | |||||||||||||
(In Thousands, except percentage changes) | |||||||||||||||||
Net loss | $ | (12,607) | $ | (24,578) | $ | (3,613) | 49 | % | (249) | % | |||||||
Adjusted EBITDA | $ | 27,769 | $ | 27,047 | $ | 33,996 | 3 | % | (18) | % | |||||||
Distributable cash flow | $ | 10,512 | $ | 8,405 | $ | 15,803 | 25 | % | (33) | % | |||||||
Net cash provided by (used in) operating | $ | (4,451) | $ | 4,823 | $ | 27,119 | (192) | % | (116) | % | |||||||
Free cash flow | $ | 14,099 | $ | 3,698 | $ | 6,252 | 281 | % | 126 | % | |||||||
As of September 30, 2020, service compressor fleet horsepower was 1,172,307 and fleet horsepower in service was 941,747(we define the overall service fleet utilization rate as the service compressor fleet horsepower in service divided by the total compressor fleet horsepower). Idle horsepower equipment under repair is not considered utilized, but we do count units on standby as utilized when the client is being billed a standby service rate.
Balance Sheet
Cash on hand at the end of the third quarter was $16.7 million. No amounts were drawn nor outstanding on the Partnership's asset-based loan at the end of the third quarter. Our debt maturity schedule reflects $81 million of unsecured bonds due in August, 2022, $400 million of first lien secured bonds due in 2025 and $156 million of second lien secured bonds due in 2026. Net leverage ratio at the end of the quarter was 5.4X.
During the third quarter, we consumed $11.8 million of cash in working capital as some of our international customers delayed payments due to the COVID-19 pandemic while we paid our domestic suppliers to maintain strong relationships and discounts.
Capital Expenditures - 2020 Expectations
We expect capital expenditures for 2020 to be between $31 million and $34 million. The forecast includes between $6 million and $7 million for new fleet additions. Maintenance capital expenditures are expected to be between $20 million and $21 million. Investments in the Helix digitally enhanced compression system and other technologies are expected to be between $5 million and $6 million
Third Quarter 2020 Cash Distribution on Common Units
On October 19, 2020, CSI Compressco announced that the board of directors of its general partner declared a cash distribution attributable to the third quarter of 2020 of $0.01 per outstanding common unit, which will be paid on November 13, 2020, to common unitholders of record as of the close of business on November 1, 2020. The distribution coverage ratio for the third quarter of 2020 was 21.9x.
Conference Call
CSI Compressco will host a conference call to discuss third quarter results today, November 2, 2020, at 9:30 a.m. Eastern Time. The phone number for the call is 1-866-374-8397. The conference call will also be available by live audio webcast and may be accessed through CSI Compressco's website at www.csicompressco.com. An audio replay of the conference call will be available at 1-877-344-7529, conference number 10148820, for one week following the conference call and the archived webcast will be available through CSI Compressco's website for thirty days following the conference call.
CSI Compressco Overview
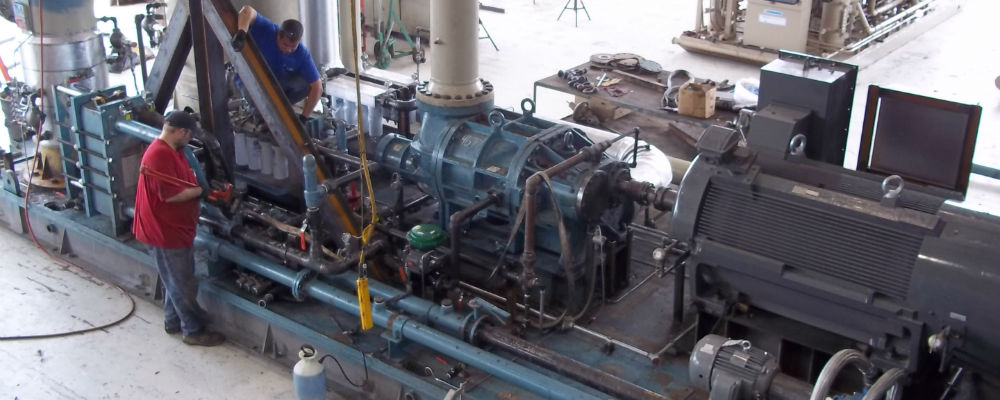
CSI Compressco is a provider of compression services and equipment for natural gas and oil production, gathering, artificial lift, transmission, processing, and storage. CSI Compressco's compression and related services business includes a fleet of more than 4,900 compressor packages providing approximately 1.17 million in aggregate horsepower, utilizing a full spectrum of low-, medium- and high-horsepower engines. CSI Compressco also provides well monitoring and automated sand separation services in conjunction with compression and related services in certain Latin American markets. CSI Compressco's aftermarket business provides compressor package reconfiguration and maintenance services. CSI Compressco's customers comprise a broad base of natural gas and oil exploration and production, midstream, transmission, and storage companies operating throughout many of the onshore producing regions of the United States, as well as in a number of foreign countries, including Mexico, Canada and Argentina. CSI Compressco is managed by CSI Compressco GP Inc., which is an indirect, wholly owned subsidiary of TETRA Technologies, Inc. (NYSE: TTI).
Forward-Looking Statements
This news release contains "forward-looking statements" and information based on our beliefs and those of our general partner, CSI Compressco GP Inc. Forward-looking statements in this news release are identifiable by the use of the following words and other similar words: "anticipates," "assumes," "believes," "budgets," "could," "estimates," "expectations," "expects," "forecasts," "goal," "intends," "may," "might," "plans," "predicts," "projects," "schedules," "seeks," "should," "targets," "will," and "would." These forward-looking statements include statements, other than statements of historical fact, including anticipated reductions in demand from our customers, future capital expenditures, reductions in SG&A and direct operating costs, the planned sale of idle compressors, resumed production of previously shut-in wells, commodity prices and demand for CSI Compressco's equipment and services and other statements regarding CSI Compressco's beliefs, expectations, plans, prospects and other future events, performance, and other statements that are not purely historical. Such forward-looking statements reflect our current views with respect to future events and financial performance, and are based on assumptions that we believe to be reasonable, but such forward-looking statements are subject to numerous risks and uncertainties, including but not limited to: economic and operating condition that are outside of our control, including the trading price of our common units; the severity and duration of the COVID-19 pandemic and related economic repercussions and the resulting negative impact on the demand for oil and gas , operational challenges relating to the COVID-19 pandemic and efforts to mitigate the spread of the virus, including logistical challenges, remote work arrangements, and supply chain disruptions, other global or national health concerns; the current significant surplus in the supply of oil and the ability of OPEC and other oil producing nations to agree on and comply with supply limitations; the duration and magnitude of the unprecedented disruption in the oil and gas industry; the levels of competition we encounter; our dependence upon a limited number of customers and the activity levels of our customers; our ability to replace our contracts with our customers, which are generally short-term contracts; the availability of adequate sources of capital to us; our existing debt levels and our ability to obtain additional financing; our ability to continue to make cash distributions, or increase cash distributions from current levels, after the establishment of reserves, payment of debt service and other contractual obligations; the restrictions on our business that are imposed under our long-term debt agreements; our operational performance; the credit and risk profile of TETRA Technologies, Inc.; ability of our general partner to retain key personnel; risks related to acquisitions and our growth strategy; the availability of raw materials and labor at reasonable prices; risks related to our foreign operations; the effect and results of litigation, regulatory matters, settlements, audits, assessments, and contingencies; or potential material weaknesses in the future; information technology risks, including the risk of cyberattack; and other risks and uncertainties contained in our Annual Report on Form 10-K and our other filings with the U.S. Securities and Exchange Commission ("SEC"), which are available free of charge on the SEC website at www.sec.gov. The risks and uncertainties referred to above are generally beyond our ability to control and we cannot predict all the risks and uncertainties that could cause our actual results to differ from those indicated by the forward-looking statements. If any of these risks or uncertainties materialize, or if any of the underlying assumptions prove incorrect, actual results may vary from those indicated by the forward-looking statements, and such variances may be material. All subsequent written and verbal forward-looking statements made by or attributable to us or to persons acting on our behalf are expressly qualified in their entirety by reference to these risks and uncertainties. You should not place undue reliance on forward-looking statements. Each forward-looking statement speaks only as of the date of the particular statement, and we undertake no obligation to update or revise any forward-looking statements we may make, except as may be required by law.
Reconciliation of Non-GAAP Financial Measures
The Partnership includes in this release the non-GAAP financial measures Adjusted EBITDA, Adjusted EBITDA margin, distributable cash flow, distribution coverage ratio, free cash flow, and net leverage ratio. Adjusted EBITDA is used as a supplemental financial measure by the Partnership's management to:
- assess the Partnership's ability to generate available cash sufficient to make distributions to the Partnership's unitholders and general partner;
- evaluate the financial performance of its assets without regard to financing methods, capital structure or historical cost basis;
- measure operating performance and return on capital as compared to those of our competitors; and
- determine the Partnership's ability to incur and service debt and fund capital expenditures.
The Partnership defines Adjusted EBITDA as earnings before interest, taxes, depreciation and amortization, and before certain charges, including impairments, bad debt expense attributable to bankruptcy of customers, equity compensation, non-cash costs of compressors sold, fair value adjustments of our Preferred Units that were issued in late 2016 and redeemed for cash on August 8, 2019, gain on extinguishment of debt, write-off of unamortized financing costs, and excluding, Preferred Units redemption premium, severance and other non-recurring or unusual expenses or charges.
Distributable cash flow is used as a supplemental financial measure by the Partnership's management, as it provides important information relating to the relationship between our financial operating performance and our cash distribution capability. Additionally, the Partnership uses distributable cash flow in setting forward expectations and in communications with the board of directors of our general partner. The Partnership defines distributable cash flow as Adjusted EBITDA less current income tax expense, maintenance capital expenditures, interest expense, and severance expense, plus non-cash interest expense.
The Partnership believes that the distribution coverage ratio provides important information relating to the relationship between the Partnership's financial operating performance and its cash distribution capability. The Partnership defines the distribution coverage ratio as the ratio of distributable cash flow to the total quarterly distribution payable, which includes, as applicable, distributions payable on all outstanding common units, the general partner interest and the general partner's incentive distribution rights.
The Partnership defines free cash flow as net cash provided by operating activities less capital expenditures, net of sales proceeds. Management primarily uses this metric to assess our ability to retire debt, evaluate our capacity to further invest and grow, and measure our performance as compared to our peer group of companies.
The Partnership defines net leverage ratio as net debt (the sum of the carrying value of long-term and short-term debt on its consolidated balance sheet, less cash, excluding restricted cash on the consolidated balance sheet and excluding outstanding letters of credit) divided by Adjusted EBITDA for Net Leverage Calculation (Adjusted EBITDA as reported externally adjusted for certain items to comply with its credit agreement) for the trailing twelve month period. Management primarily uses this metric to assess the Partnership's ability to borrow, reduce debt, add to cash balances, pay distributions, and fund investing and financing activities.
These non-GAAP financial measures should not be considered an alternative to net income, operating income, cash flows from operating activities or any other measure of financial performance presented in accordance with U.S. GAAP. These non-GAAP financial measures may not be comparable to Adjusted EBITDA, gross margin, distributable cash flow, free cash flow or other similarly titled measures of other entities, as other entities may not calculate these non-GAAP financial measures in the same manner as CSI Compressco. Management compensates for the limitation of these non-GAAP financial measures as an analytical tool by reviewing the comparable U.S. GAAP measures, understanding the differences between the measures and incorporating this knowledge into management's decision-making process. Furthermore, these non-GAAP measures should not be viewed as indicative of the actual amount of cash that CSI Compressco has available for distributions or that the Partnership plans to distribute for a given period, nor should they be equated to available cash as defined in the Partnership's partnership agreement.
Schedule A - Income Statement
| |||||||||||||||||||
Three Months Ended | Nine Months Ended | ||||||||||||||||||
Sep 30, | Jun 30, | Sep 30, | Sep 30, | Sep 30, | |||||||||||||||
(In Thousands, Except per Unit Amounts) | |||||||||||||||||||
Revenues: | |||||||||||||||||||
Compression and related services | $ | 53,419 | $ | 56,336 | $ | 65,037 | $ | 175,520 | $ | 192,973 | |||||||||
Aftermarket services | 13,862 | 15,737 | 20,426 | 47,569 | 52,196 | ||||||||||||||
Equipment sales | 11,877 | 24,340 | 28,284 | 42,761 | 107,870 | ||||||||||||||
Total revenues | $ | 79,158 | $ | 96,413 | $ | 113,747 | $ | 265,850 | $ | 353,039 | |||||||||
Cost of revenues (excluding depreciation and | |||||||||||||||||||
Cost of compression and related services | $ | 25,133 | $ | 25,395 | $ | 30,395 | $ | 82,136 | $ | 93,536 | |||||||||
Cost of aftermarket services | 11,815 | 13,433 | 17,163 | 41,493 | 43,841 | ||||||||||||||
Cost of equipment sales | 12,465 | 24,415 | 26,518 | 43,580 | 98,149 | ||||||||||||||
Total cost of revenues | $ | 49,413 | $ | 63,243 | $ | 74,076 | $ | 167,209 | $ | 235,526 | |||||||||
Depreciation and amortization | 19,947 | 20,117 | 18,459 | 59,972 | 56,045 | ||||||||||||||
Impairments of long-lived assets | — | 8,977 | 849 | 14,348 | 3,160 | ||||||||||||||
Insurance recoveries | — | (517) | (325) | (517) | (325) | ||||||||||||||
Selling, general, and administrative expense | 9,150 | 10,172 | 11,336 | 29,578 | 32,975 | ||||||||||||||
Interest expense, net | 13,886 | 13,580 | 13,533 | 40,635 | 39,877 | ||||||||||||||
Series A Preferred fair value adjustment | — | — | — | — | 1,470 | ||||||||||||||
Other (income) expense, net | (1,326) | 4,403 | (205) | 3,517 | 21 | ||||||||||||||
Loss before income tax provision | $ | (11,912) | $ | (23,562) | $ | (3,976) | $ | (48,892) | $ | (15,710) | |||||||||
Provision (benefit) for income taxes | 695 | 1,016 | (363) | 1,923 | 3,306 | ||||||||||||||
Net loss | $ | (12,607) | $ | (24,578) | $ | (3,613) | $ | (50,815) | $ | (19,016) | |||||||||
Net loss per diluted common unit | $ | (0.25) | $ | (0.51) | $ | (0.08) | $ | (1.05) | $ | (0.40) | |||||||||
Schedule B - Reconciliation of Net Loss to Adjusted EBITDA, Distributable Cash Flow and Distribution
The following table reconciles net loss to Adjusted EBITDA, distributable cash flow and distribution coverage
Results of Operations (unaudited) | |||||||||||||||||||
Three Months Ended | Nine Months Ended | ||||||||||||||||||
Sep 30, 2020 | Jun 30, 2020 | Sep 30, 2019 | Sep 30, 2020 | Sep 30, 2019 | |||||||||||||||
(In Thousands, except Ratios) | |||||||||||||||||||
Net loss | $ | (12,607) | $ | (24,578) | $ | (3,613) | $ | (50,815) | $ | (19,016) | |||||||||
Interest expense, net | 13,886 | 13,580 | 13,533 | 40,635 | 39,877 | ||||||||||||||
Provision (benefit) for income taxes | 695 | 1,016 | (363) | 1,923 | 3,306 | ||||||||||||||
Depreciation and amortization | 19,947 | 20,117 | 18,459 | 59,972 | 56,045 | ||||||||||||||
Impairments of fixed assets and inventory | — | 8,977 | 849 | 14,348 | 3,313 | ||||||||||||||
Bad debt expense attributable to bankruptcy of customer | — | — | 1,768 | — | 1,768 | ||||||||||||||
Non-cash cost of compressors sold | 4,804 | 631 | 2,803 | 7,244 | 3,841 | ||||||||||||||
Equity compensation | 232 | 488 | (211) | 1,044 | 744 | ||||||||||||||
Series A Preferred redemption premium | — | — | 399 | — | 1,468 | ||||||||||||||
Series A Preferred fair value adjustments | — | — | — | — | 1,470 | ||||||||||||||
Bond exchange expenses | 22 | 4,755 | — | 4,777 | — | ||||||||||||||
Severance | 484 | 1,084 | 118 | 1,840 | 118 | ||||||||||||||
Other | 306 | 977 | 254 | 1,610 | 630 | ||||||||||||||
Adjusted EBITDA | $ | 27,769 | $ | 27,047 | $ | 33,996 | $ | 82,578 | $ | 93,564 | |||||||||
Less: | |||||||||||||||||||
Current income tax expense | 516 | 615 | 34 | 1,335 | 2,757 | ||||||||||||||
Maintenance capital expenditures | 4,354 | 3,951 | 5,729 | 14,795 | 16,358 | ||||||||||||||
Interest expense | 13,886 | 13,580 | 13,533 | 40,635 | 39,877 | ||||||||||||||
Severance and other | 790 | 2,061 | 372 | 3,450 | 748 | ||||||||||||||
Plus: | |||||||||||||||||||
Non-cash items included in interest expense | 2,289 | 1,565 | 1,475 | 5,010 | 4,004 | ||||||||||||||
Distributable cash flow | $ | 10,512 | $ | 8,405 | $ | 15,803 | $ | 27,373 | $ | 37,828 | |||||||||
Cash distribution attributable to period | $ | 480 | $ | 480 | $ | 477 | $ | 1,438 | $ | 1,431 | |||||||||
Distribution coverage ratio | 21.9x | 17.5x | 33.1x | 19x | 26.4x | ||||||||||||||
Schedule C - Reconciliation of Net Cash Provided by Operating Activities Operations to Free Cash Flow
The following table reconciles net cash provided by operating activities to free cash flow for the three and six
Results of Operations (unaudited) | |||||||||||||||||||
Three Months Ended | Nine Months Ended | ||||||||||||||||||
Sep 30, 2020 | Jun 30, 2020 | Sep 30, 2019 | Sep 30, 2020 | Sep 30, 2019 | |||||||||||||||
(In Thousands) | |||||||||||||||||||
Net cash provided by operating activities | $ | (4,451) | $ | 4,823 | $ | 27,119 | $ | 13,729 | $ | 67,461 | |||||||||
Capital expenditures, net of sales proceeds | 1,550 | (1,125) | (20,867) | (6,058) | (60,453) | ||||||||||||||
Midland proceeds | $ | 17,000 | $ | — | $ | — | $ | 17,000 | $ | — | |||||||||
Free cash flow | $ | 14,099 | $ | 3,698 | $ | 6,252 | $ | 24,671 | $ | 7,008 | |||||||||
Schedule D – Reconciliation to Adjusted EBITDA Margin (unaudited) | |||||||||||||||||||
Three Months Ended | Nine Months Ended | ||||||||||||||||||
Sep 30, 2020 | Jun 30, 2020 | Sep 30, 2019 | Sep 30, 2020 | Sep 30, 2019 | |||||||||||||||
Consolidated | (In Thousands, except Margin %) | ||||||||||||||||||
Revenue | $ | 79,158 | $ | 96,413 | $ | 113,747 | $ | 265,850 | $ | 353,039 | |||||||||
Income (loss) before tax | $ | (11,912) | $ | (23,562) | $ | (3,976) | $ | (48,892) | $ | (15,710) | |||||||||
Adjusted income (loss) before tax | (15.0) | % | (24.4) | % | (3.5) | % | (18.4) | % | (4.4) | % | |||||||||
Adjusted EBITDA (Schedule B) | $ | 27,769 | $ | 27,047 | $ | 33,996 | $ | 82,578 | $ | 93,564 | |||||||||
Adjusted EBITDA Margin | 35.1 | % | 28.1 | % | 29.9 | % | 31.1 | % | 26.5 | % | |||||||||
Schedule E – Reconciliation of Net Loss to Adjusted EBITDA for Net Leverage Ratio Calculation (unaudited) | |||
Twelve Months | |||
Sep 30, 2020 | |||
Net loss | $ | (52,772) | |
Interest expense, net | 54,133 | ||
Provision for income taxes | 1,970 | ||
Depreciation and amortization | 80,590 | ||
Impairments and other charges | 14,348 | ||
Bad debt expense attributable to bankruptcy of customer | — | ||
Non-cash cost of compressors sold | 9,426 | ||
Equity Compensation | 1,364 | ||
Series A Preferred redemption premium | — | ||
Financing Fees | 4,777 | ||
Severance | 1,840 | ||
Other | 1,610 | ||
Adjusted EBITDA | $ | 117,286 | |
EBITDA adjustments to comply with Credit Agreement | (1,109) | ||
Adjusted EBITDA for Net Leverage Calculation | $ | 116,177 | |
Debt Schedule | Sep 30, 2020 | ||
7.25% Senior Notes | 80,722 | ||
7.50% First Lien Notes | 400,000 | ||
10.00%/10.75% Second Lien Notes | 155,529 | ||
Asset Based Loan | — | ||
Letters of Credit | 2,500 | ||
Cash on Hand | (16,699) | ||
Net Debt | $ | 622,052 | |
Net Leverage Ratio (Net Debt/Adjusted EBITDA for Net | 5.4x | ||
Schedule F – Balance Sheet
| |||||||
September 30, | December 31, | ||||||
(in thousands) | (Unaudited) | ||||||
ASSETS | |||||||
Current assets: | |||||||
Cash and cash equivalents | $ | 16,699 | $ | 2,370 | |||
Trade accounts receivable, net of allowances for doubtful accounts of $1,228 as of | 56,521 | 64,724 | |||||
Inventories | 33,981 | 56,037 | |||||
Prepaid expenses and other current assets | 6,303 | 4,162 | |||||
Total current assets | 113,504 | 127,293 | |||||
Property, plant, and equipment: | |||||||
Land and building | 13,259 | 35,125 | |||||
Compressors and equipment | 978,422 | 976,469 | |||||
Vehicles | 7,904 | 9,205 | |||||
Construction in progress | 8,817 | 26,985 | |||||
Total property, plant, and equipment | 1,008,402 | 1,047,784 | |||||
Less accumulated depreciation | (435,902) | (405,417) | |||||
Net property, plant, and equipment | 572,500 | 642,367 | |||||
Other assets: | |||||||
Deferred tax asset | 24 | 24 | |||||
Intangible assets, net of accumulated amortization of $29,971 as of September 30, | 25,797 | 28,017 | |||||
Operating lease right-of-use assets | 34,680 | 21,006 | |||||
Other assets | 4,300 | 3,539 | |||||
Total other assets | 64,801 | 52,586 | |||||
Total assets | $ | 750,805 | $ | 822,246 | |||
LIABILITIES AND PARTNERS' CAPITAL | |||||||
Current liabilities: | |||||||
Accounts payable | $ | 19,404 | $ | 47,837 | |||
Unearned income | 6,463 | 9,505 | |||||
Accrued liabilities and other | 41,600 | 42,581 | |||||
Amounts payable to affiliates | 9,428 | 7,704 | |||||
Total current liabilities | 76,895 | 107,627 | |||||
Other liabilities: | |||||||
Long-term debt, net | 636,943 | 638,238 | |||||
Deferred tax liabilities | 1,620 | 1,211 | |||||
Long-term affiliate payable | 11,858 | 12,324 | |||||
Operating lease liabilities | 25,896 | 13,822 | |||||
Other long-term liabilities | 17 | 33 | |||||
Total other liabilities | 676,334 | 665,628 | |||||
Commitments and contingencies | |||||||
Partners' capital: | |||||||
General partner interest | (555) | 180 | |||||
Common units (47,344,351 units issued and outstanding at September 30, 2020 | 12,776 | 63,384 | |||||
Accumulated other comprehensive income (loss) | (14,645) | (14,573) | |||||
Total partners' capital | (2,424) | 48,991 | |||||
Total liabilities and partners' capital | $ | 750,805 | $ | 822,246 | |||
SOURCE CSI Compressco LP

For further information: Elijio Serrano, CFO, CSI Compressco LP, Phone: (281) 367-1983