

CSI Compressco LP Announces Fourth Quarter And Full Year 2017 Results
THE WOODLANDS, Texas, Feb. 27, 2018 /PRNewswire/ -- CSI Compressco LP ("CSI Compressco") (NASDAQ: CCLP) today announced fourth quarter and full year 2017 consolidated financial results. Consolidated revenues for the quarter ended December 31, 2017, were $83.1 million compared to $71.6 million for the third quarter of 2017 and $82.9 million for the fourth quarter of 2016. Compared to the third quarter of 2017, compression services revenues increased 3.3%, reflecting increases in fleet utilization. Equipment sales increased by $8.5 million from the third quarter to $18.9 million. Net loss for the quarter ended December 31, 2017 was $10.7 million compared to a $7.8 million loss for the third quarter of 2017 and $12.1 million loss for the fourth quarter of 2016.
![]()
Selected key operational and financial metrics are as follows:
- Orders for new equipment sales in the fourth quarter were $16.7 million. In early January, CSI Compressco received a $67 million order for large horsepower equipment to be fabricated for a midstream operator in the Permian Basin. This equipment is expected to ship during the second half of 2018 and the first half of 2019.
- Backlog for equipment sales was $47.5 million as of December 31, 2017. With the January order, backlog increased in January to approximately $117 million.
- Overall service fleet utilization increased 180 basis points (bps) compared to the end of the third quarter, to 83.2%. Utilization for large horsepower equipment, greater than 800 hp per unit, increased to 92.3%, up 220 bps sequentially.
- Distributable cash flow(1) for the quarter was $5.4 million, resulting in a distribution coverage ratio of 0.73X
- Maintenance capital expenditures were $6.9 million as additional previously idle equipment was made ready for deployment to address the strong demand for field gathering and gas lift.
- Adjusted EBITDA(1) was $21.0 million, compared to $23.3 million in the third quarter, as the third quarter included a non-recurring gain of $3.0 million from insurance proceeds.
(1) Non-GAAP financial measures reconciled to the nearest GAAP number on Schedules A, B, and C
As of December 31, 2017, aggregate compression services fleet horsepower totaled 1,081,919 horsepower and the fleet utilization rate was 83.2%. Utilization of our highest horsepower category, equipment of greater than 800 horsepower per unit, was 92.3% at the end of the quarter. We define the fleet utilization rate as the aggregate compressor package horsepower in service divided by the aggregate compressor package fleet horsepower as of a given date. We do not exclude idle horsepower under repair or horsepower that is otherwise impaired from our calculation of utilization rate.
Unaudited results of operations for the quarter ended December 31, 2017 compared to the prior quarter and the corresponding prior year quarter are presented in the accompanying financial tables.
|
Three Months Ended |
|||||||||
|
Dec 31, 2017 |
Sep 30, 2017 |
Dec 31, 2016 |
Q4-17 vs. |
Q4-17 vs. | |||||
|
(In Thousands, Except Ratios, Per Unit Amounts and Percentages) | |||||||||
|
Net loss |
$ (10,673) |
$ (7,821) |
$ (12,138) |
(36)% |
12% | ||||
|
Adjusted EBITDA(1) |
$ 21,022 |
$ 23,341 |
$ 21,682 |
(10)% |
(3)% | ||||
|
Distributable cash flow(1) |
$ 5,368 |
$ 10,778 |
$ 8,798 |
(50)% |
(39)% | ||||
|
Quarterly cash distribution per unit |
$ 0.1875 |
$ 0.1875 |
$ 0.3775 |
— |
— | ||||
|
Distribution coverage ratio(1) |
0.73x |
1.56x |
0.68x |
— |
— | ||||
|
Net cash provided by operating activities |
$ 14,496 |
$ 13,218 |
$ 15,922 |
10 % |
(9)% | ||||
|
Free cash flow(1) |
$ 3,083 |
$ 10,982 |
$ 12,865 |
(72)% |
(76)% | ||||
|
(1) Non-GAAP financial measures reconciled to the nearest GAAP number on Schedules B and C. |
Owen Serjeant, President of CSI Compressco, commented, "The compression market is in the midst of a robust recovery. In the fall of 2017, we experienced an increasing demand for large horsepower equipment to address gathering system requirements, particularly throughout the West Texas, South Texas and the Oklahoma SCOOP/Stack markets as the rig count climbed to over 900 active rigs. The latest demand is now coming for mid- to large horsepower equipment services as the industry is moving to centralized surface gas lift as initial production rates on new wells are not as strong as they were earlier in 2017. With the migration toward pad drilling and tighter well spacing, combined with large volumes of associated gas, operators have started moving toward centralized gas lift using larger horsepower compression equipment to perform surface lift simultaneously on multiple wells."
"In addition to the stronger demand for gathering systems equipment based on incremental infield drilling and stronger Delaware Basin activity, plus increased surface gas lift requirements, we are seeing an increase in the request for pricing and proposals to fabricate and deliver larger horsepower equipment. In the fourth quarter, we received orders for $16.7 million of new equipment to be delivered in 2017. In early January, 2018, we received a $67 million order to deliver 45 new large horsepower units to a midstream operator in West Texas. This recent order is the largest in the history of CSI and Compressco and is scheduled for delivery in the second half of 2018 and first half of 2019. Customers are recognizing that the drilling program schedules into 2019 will require more horsepower to enhance production, compress and move associated gas through the gathering systems and build or expand gas processing facilities. We are also seeing increasing demand to build and deploy equipment in Latin America, primarily in Mexico and Argentina."
The increased activity has pushed utilization of our large horsepower services equipment to more than 92%. We are now also experiencing strong demand for equipment in the 101-800 horsepower range to address the gas lift opportunities. As a result of this stronger demand and higher utilization levels, we are starting to push pricing higher to recover discounts conceded during the downturn of the past three years. Maintenance capital expenditures increased in the fourth quarter as the stronger demand is requiring us to make ready equipment that had been idle for longer periods of time. We are also preparing for deployment more of the GasJack and VJack service fleet to areas including the Rockies and the Permian Basin.
This uptick in demand is also driving increases in aftermarket services (AMS) as customers are catching up on maintenance and deploying previously idle equipment. 2017 AMS orders increased 76% year over year. We entered 2018 with $10.5 million in AMS backlog.
Forward-Looking Guidance
Projected 2018 total capital expenditures are expected to be between $55 million and $75 million. Maintenance capital expenditures are expected to be between $15 million and $20 million. We expect to fund these capital expenditures through a combination of internally generated cash flow, as well as borrowings under our credit facility, which we expect to extend or replace during 2018. Capital market sources may also be utilized depending on market conditions. We believe a combination of these sources should position us to invest growth capital to take advantage of the recovery occurring in multiple areas of our operations.
Conference Call
CSI Compressco will host a conference call to discuss fourth quarter 2017 results today, February 27, 2018, at 10:30 a.m. Eastern Time. The phone number for the call is 1-866-374-8397. The conference will also be available by live audio webcast and may be accessed through CSI Compressco's website at www.csicompressco.com.
Fourth Quarter 2017 Cash Distribution on Common Units
On January 22, 2018, CSI Compressco announced that the board of directors of its general partner declared a cash distribution attributable to the fourth quarter of 2017 of $0.1875 per outstanding common unit, which was paid on February 14, 2018 to common unitholders of record as of the close of business on February 1, 2018. The distribution coverage ratio (which is a Non-GAAP Financial Measure defined and reconciled to the closest GAAP financial measure below) for the fourth quarter of 2017 was 0.73X.
CSI Compressco Overview
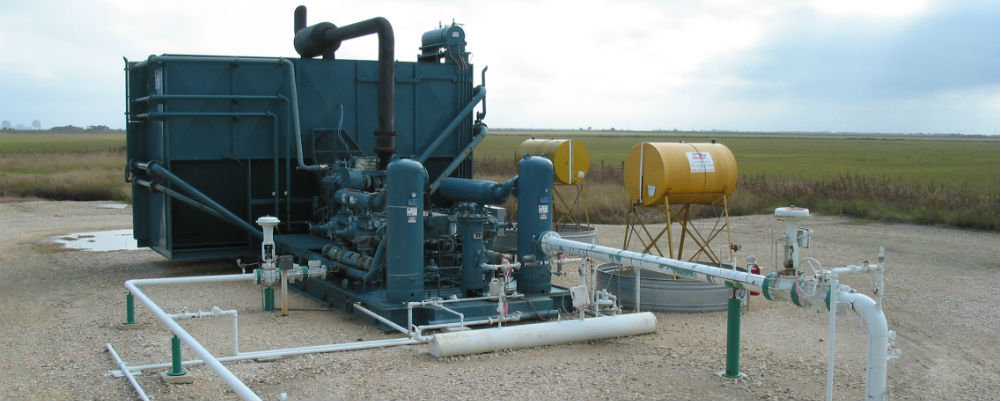
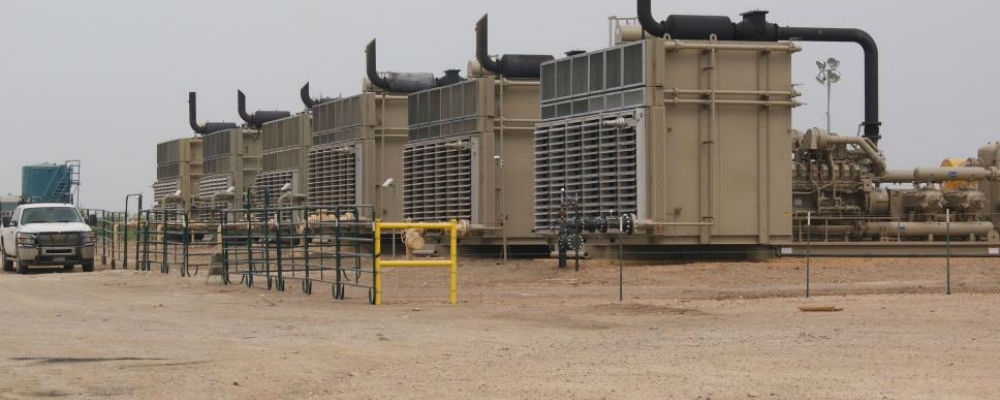
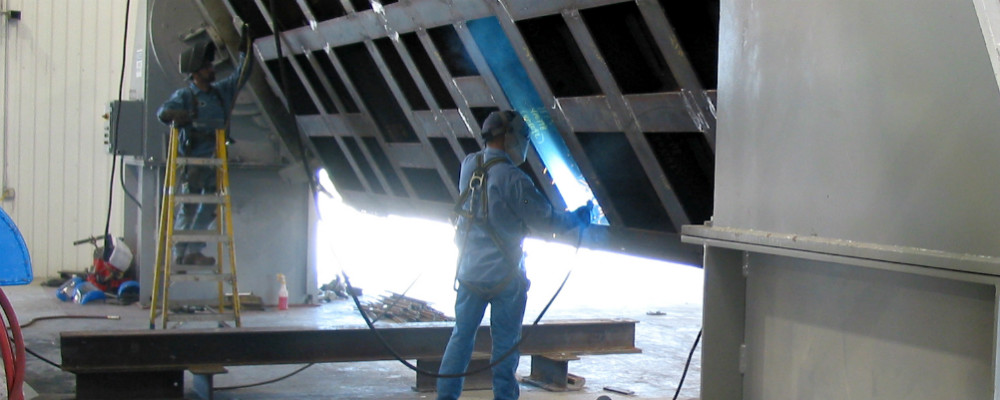
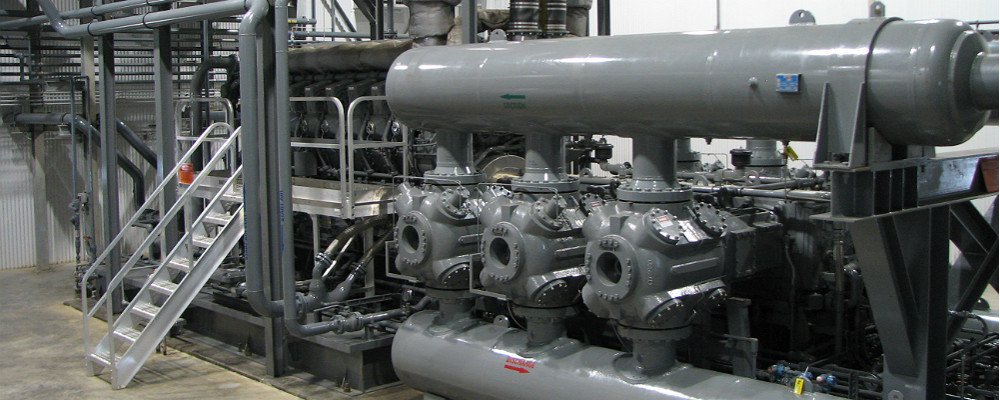
CSI Compressco is a provider of compression services and equipment for natural gas and oil production, gathering, transportation, processing, and storage. CSI Compressco's compression and related services business includes a fleet of more than 5,700 compressor packages providing approximately 1.1 million in aggregate horsepower, utilizing a full spectrum of low, medium and high horsepower engines. CSI Compressco also provides well monitoring and automated sand separation services in conjunction with compression services in Mexico. CSI Compressco's equipment sales business includes the fabrication and sale of standard compressor packages, custom-designed compressor packages and oilfield fluid pump systems designed and fabricated primarily at our facility in Midland, Texas. CSI Compressco's aftermarket business provides compressor package reconfiguration and maintenance services, as well as the sale of compressor package parts and components manufactured by third-party suppliers. CSI Compressco's customers comprise a broad base of natural gas and oil exploration and production, mid-stream, transmission, and storage companies operating throughout many of the onshore producing regions of the United States, as well as in a number of foreign countries, including Mexico, Canada and Argentina. CSI Compressco is managed by CSI Compressco GP Inc., which is an indirect, wholly owned subsidiary of TETRA Technologies, Inc. (NYSE: TTI).
Forward-Looking Statements
This news release contains "forward-looking statements" and information based on our beliefs and those of our general partner, CSI Compressco GP Inc. Forward-looking statements in this news release are identifiable by the use of the following words and other similar words: "anticipates," "assumes," "believes," "budgets," "could," "estimates," "expects," "forecasts," "goal," "intends," "may," "might," "plans," "predicts," "projects," "schedules," "seeks," "should," "targets," "will," and "would." These forward-looking statements include statements, other than statements of historical fact, concerning the recovery of the oil and gas industry and CSI Compressco's strategy, future operations, financial position, estimated revenues, negotiations with our bank lenders, projected costs, and other statements regarding CSI Compressco's beliefs, expectations, plans, prospects and other future events and performance. Such forward-looking statements reflect our current views with respect to future events and financial performance, and are based on assumptions that we believe to be reasonable, but such forward-looking statements are subject to numerous risks and uncertainties, including but not limited to: economic and operating conditions that are outside of our control, including the supply, demand and prices of crude oil and natural gas; the levels of competition we encounter; the activity levels of our customers; the availability of adequate sources of capital to us; our ability to comply with contractual obligations, including those under our financing arrangements; our operational performance; the loss of our management; risks related to acquisitions and our growth strategy; the availability of raw materials and labor at reasonable prices; risks related to our foreign operations; the effect and results of litigation, regulatory matters, settlements, audits, assessments, and contingencies; or potential material weaknesses in the future; information technology risks, including the risk of cyberattack; and other risks and uncertainties contained in our Annual Report on Form 10-K and our other filings with the U.S. Securities and Exchange Commission ("SEC"), which are available free of charge on the SEC website at www.sec.gov. The risks and uncertainties referred to above are generally beyond our ability to control and we cannot predict all the risks and uncertainties that could cause our actual results to differ from those indicated by the forward-looking statements. If any of these risks or uncertainties materialize, or if any of the underlying assumptions prove incorrect, actual results may vary from those indicated by the forward-looking statements, and such variances may be material. All subsequent written and verbal forward-looking statements made by or attributable to us or to persons acting on our behalf are expressly qualified in their entirety by reference to these risks and uncertainties. You should not place undue reliance on forward-looking statements. Each forward-looking statement speaks only as of the date of the particular statement, and we undertake no obligation to update or revise any forward-looking statements we may make, except as may be required by law.
|
Schedule A - Income Statement | |||||||||
|
Results of Operations (unaudited) |
Three Months Ended |
Twelve Months Ended | |||||||
|
Dec 31, 2017 |
Sep 30, 2017 |
Dec 31, 2016 |
Dec 31, 2017 |
Dec 31, 2016 | |||||
|
(in Thousands, Except per Unit Amounts | |||||||||
|
Revenues: |
|||||||||
|
Compression and related services |
$ 53,359 |
$ 51,662 |
$ 51,395 |
$ 205,774 |
$ 224,736 | ||||
|
Aftermarket services |
10,854 |
9,517 |
6,900 |
40,287 |
33,303 | ||||
|
Equipment sales |
18,888 |
10,419 |
24,573 |
49,505 |
53,324 | ||||
|
Total revenues |
83,101 |
71,598 |
82,868 |
295,566 |
311,363 | ||||
|
Cost of revenues (excluding depreciation and amortization expense): |
|||||||||
|
Cost of compression and related services |
30,763 |
28,347 |
28,628 |
116,956 |
117,154 | ||||
|
Cost of aftermarket services |
8,440 |
7,733 |
5,730 |
32,256 |
25,362 | ||||
|
Cost of equipment sales |
16,145 |
9,424 |
24,337 |
44,286 |
48,744 | ||||
|
Total cost of revenues |
55,348 |
45,504 |
58,695 |
193,498 |
191,260 | ||||
|
Depreciation and amortization |
17,280 |
17,361 |
17,107 |
69,140 |
72,123 | ||||
|
Impairments of long-lived assets |
— |
— |
2,357 |
— |
10,223 | ||||
|
Insurance recoveries |
— |
(2,352) |
— |
(2,352) |
— | ||||
|
Selling, general, and administrative expense |
7,760 |
8,682 |
8,530 |
33,438 |
36,222 | ||||
|
Goodwill Impairment |
— |
— |
— |
— |
92,334 | ||||
|
Interest expense, net |
11,232 |
11,071 |
10,621 |
43,135 |
38,055 | ||||
|
Series A Preferred fair value adjustment |
1,561 |
(1,300) |
(2,162) |
(3,402) |
5,036 | ||||
|
Other expense, net |
— |
(319) |
(510) |
(216) |
2,383 | ||||
|
Loss before income tax provision |
(10,080) |
(7,049) |
(11,770) |
(37,675) |
(136,273) | ||||
|
Provision (benefit) for income taxes |
593 |
772 |
368 |
2,784 |
1,865 | ||||
|
Net loss |
$ (10,673) |
$ (7,821) |
$ (12,138) |
$ (40,459) |
$ (138,138) | ||||
|
Net income per diluted common unit |
$ (0.29) |
$ (0.22) |
$ (0.36) |
$ (1.13) |
$ (4.07) | ||||
Reconciliation of Non-GAAP Financial Measures
The Partnership includes in this release the non-GAAP financial measures Adjusted EBITDA, distributable cash flow, distribution coverage ratio, and free cash flow. Adjusted EBITDA is used as a supplemental financial measure by the Partnership's management to:
- assess the Partnership's ability to generate available cash sufficient to make distributions to the Partnership's unitholders and general partner;
- evaluate the financial performance of its assets without regard to financing methods, capital structure or historical cost basis;
- measure operating performance and return on capital as compared to those of our competitors;
- determine the Partnership's ability to incur and service debt and fund capital expenditures; and
- monitor the financial performance measure used in the Partnership's bank credit facility financial covenant.
The Partnership defines Adjusted EBITDA as earnings before interest, taxes, depreciation, and amortization, and before certain non-cash charges consisting of impairments, bad debt expense attributable to bankruptcy of customer, non-cash costs of compressors sold, equity compensation, fair value adjustments of our Preferred Units, administrative expenses under the Omnibus Agreement paid in equity using common units, severance expense, and software implementation expense.
Distributable cash flow is used as a supplemental financial measure by the Partnership's management, as it provides important information relating to the relationship between our financial operating performance and our cash distribution capability. Additionally, the Partnership uses distributable cash flow in setting forward expectations and in communications with the board of directors of our general partner. The Partnership defines distributable cash flow as Adjusted EBITDA less current income tax expense, maintenance capital expenditures, interest expense, and severance expense, plus non-cash interest expense.
The Partnership believes that the distribution coverage ratio provides important information relating to the relationship between the Partnership's financial operating performance and its cash distribution capability. The Partnership defines the distribution coverage ratio as the ratio of distributable cash flow to the total quarterly distribution payable, which includes, as applicable, distributions payable on all outstanding common units, the general partner interest and the general partner's incentive distribution rights.
The Partnership defines free cash flow as net cash provided by operating activities less capital expenditures, net of sales proceeds. Management primarily uses this metric to assess our ability to retire debt, evaluate our capacity to further invest and grow, and measure our performance as compared to our peer group of companies.
These non-GAAP financial measures should not be considered an alternative to net income, operating income, cash flows from operating activities or any other measure of financial performance presented in accordance with GAAP. These non-GAAP financial measures may not be comparable to Adjusted EBITDA, distributable cash flow, free cash flow or other similarly titled measures of other entities, as other entities may not calculate these non-GAAP financial measures in the same manner as CSI Compressco. Management compensates for the limitation of these non-GAAP financial measures as an analytical tool by reviewing the comparable GAAP measures, understanding the differences between the measures and incorporating this knowledge into management's decision making process. Furthermore, these non-GAAP measures should not be viewed as indicative of the actual amount of cash that CSI Compressco has available for distributions or that the Partnership plans to distribute for a given period, nor should they be equated to available cash as defined in the Partnership's partnership agreement.
The following table reconciles net income (loss) to Adjusted EBITDA, distributable cash flow and distribution coverage ratio for the three month periods ended December 31 2017, September 30, 2017, December 31, 2016, and the twelve-month periods ended December 31, 2017 and 2016:
|
Schedule B - Reconciliation of Net Income/(Loss) to Adjusted EBITDA, Distributable Cash Flow and Distribution Coverage Ratio | |||||||||
|
Three Months Ended |
Twelve Months Ended | ||||||||
|
Dec 31, 2017 |
Sep 30, 2017 |
Dec 31, 2016 |
Dec 31, 2017 |
Dec 31, 2016 | |||||
|
(In Thousands) |
|||||||||
|
Net loss |
$ (10,673) |
$ (7,821) |
$ (12,138) |
$ (40,459) |
$ (138,138) | ||||
|
Interest expense, net |
11,232 |
11,071 |
10,621 |
43,135 |
38,055 | ||||
|
Provision for income taxes |
593 |
772 |
368 |
2,784 |
1,865 | ||||
|
Depreciation and amortization |
17,280 |
17,361 |
17,107 |
69,140 |
72,123 | ||||
|
Impairments of long-lived assets |
— |
— |
2,357 |
— |
10,223 | ||||
|
Goodwill Impairment |
— |
— |
— |
— |
92,334 | ||||
|
Bad debt expense attributable to bankruptcy of customer |
— |
— |
— |
— |
728 | ||||
|
Non-cash cost of compressors sold |
1,768 |
2,406 |
3,941 |
8,505 |
6,772 | ||||
|
Equity Compensation |
(933) |
261 |
792 |
1,219 |
3,028 | ||||
|
Series A Preferred transaction costs |
— |
— |
85 |
37 |
3,131 | ||||
|
Series A Preferred fair value adjustments |
1,561 |
(1,300) |
(2,162) |
(3,402) |
5,036 | ||||
|
Gain on extinguishment of debt |
— |
— |
(865) |
— |
(1,405) | ||||
|
Omnibus expense paid in equity |
— |
— |
1,576 |
1,746 |
1,576 | ||||
|
Severance |
— |
8 |
— |
63 |
562 | ||||
|
Software implementation |
195 |
583 |
— |
974 |
— | ||||
|
Adjusted EBITDA |
21,022 |
23,341 |
21,682 |
83,742 |
95,890 | ||||
|
Less: |
|||||||||
|
Current income tax expense |
311 |
545 |
608 |
2,027 |
1,835 | ||||
|
Maintenance capital expenditures |
6,936 |
3,841 |
4,840 |
21,055 |
11,359 | ||||
|
Interest Expense, net |
11,232 |
11,071 |
10,621 |
43,135 |
38,055 | ||||
|
Severance |
— |
8 |
— |
63 |
562 | ||||
|
Plus: |
|||||||||
|
Non-cash items included in interest expense |
2,825 |
2,902 |
3,185 |
11,546 |
6,873 | ||||
|
Distributable cash flow |
5,368 |
10,778 |
8,798 |
29,008 |
50,952 | ||||
|
Cash distribution attributable to period |
7,389 |
6,916 |
12,870 |
27,582 |
51,237 | ||||
|
Distribution coverage ratio |
0.73x |
1.56x |
0.68x |
1.05x |
0.99x | ||||
The following table reconciles net cash provided by operating activities to free cash flow for the three month periods ended December 31 2017, September 30, 2017, December 31 2016, and the twelve-month periods ended December 31, 2017 and 2016:
|
Schedule C - Reconciliation of Net Cash Provided by Operating Activities to Free Cash Flow | |||||||||
|
Results of Operations (unaudited) |
Three Months Ended |
Twelve Months Ended | |||||||
|
Dec 31, 2017 |
Sep 30, 2017 |
Dec 31, 2016 |
Dec 31, 2017 |
Dec 31, 2016 | |||||
|
(In Thousands) | |||||||||
|
Cash from operations |
$ 14,496 |
$ 13,218 |
$ 15,922 |
$ 39,068 |
$ 61,444 | ||||
|
Capital expenditures, net of sales proceeds |
(11,413) |
(2,236) |
(3,057) |
(25,126) |
(10,659) | ||||
|
Free cash flow |
$ 3,083 |
$ 10,982 |
$ 12,865 |
$ 13,942 |
$ 50,785 | ||||
SOURCE CSI Compressco LP
For further information: CSI Compressco LP, The Woodlands, Texas, Elijio V Serrano, Chief Financial Officer, Phone: 281-364-5029, www.csicompressco.com