

CSI Compressco LP Announces Third Quarter 2015 Results
PR Newswire
MIDLAND, Texas
MIDLAND, Texas, Nov. 5, 2015 /PRNewswire/ -- CSI Compressco LP (CSI Compressco or the Partnership) (NASDAQ: CCLP) today announced third quarter 2015 consolidated results. Adjusted earnings before interest, taxes, depreciation, and amortization (Adjusted EBITDA) for the third quarter of 2015 were $32.0 million, with net income of $1.6 million. This compares to Adjusted EBITDA and net income (loss) of $26.1 million and $(2.6) million, respectively, during the prior year period. Distributable cash flow for the quarter ended September 30, 2015 was $21.8 million (Adjusted EBITDA and distributable cash flow are non-GAAP financial measures that are defined and reconciled to the nearest GAAP financial measures later in the release).
Highlights of the third quarter 2015 results include:
- Adjusted EBITDA(1) of $32.0 million.
- Record quarterly revenues of $128.9 million.
- Third quarter distribution of $0.5025 per unit, a $0.0025 increase compared to the prior quarter and a 9% increase compared to the third quarter of 2014. This is the ninth consecutive quarterly distribution increase and the twelfth increase to our quarterly distribution in the past thirteen quarters.
- 1.25x distribution coverage ratio(1) in the third quarter.
- Total compression services fleet horsepower of 1,160,976 at quarter end, representing net increases of 22,320 (2%) and 88,672 (8%) horsepower over prior quarter and prior year quarter respectively.
|
Quarter Ended |
|||||
|
September 30, 2015 |
September 30, 2014 |
2015 vs. 2014 | |||
|
(In Thousands, Except Ratios, and Percentages) | |||||
|
Adjusted EBITDA(1) |
$ 31,978 |
$ 26,062 |
23 % | ||
|
Distributable cash flow(1) |
$ 21,807 |
$ 19,808 |
10 % | ||
|
Cash distribution per unit annualized |
$ 2.01 |
$ 1.84 |
9 % | ||
|
Distribution coverage ratio(1) |
1.25x |
1.27x |
— | ||
|
Fleet capital expenditures |
$ 15,779 |
$ 20,508 |
(23%) | ||
|
(1) Non-GAAP financial measures reconciled to the nearest GAAP number later in the release. |
Consolidated revenues and income (loss) before tax for the quarter ended September 30, 2015 were $128.9 million and $2.0 million, respectively, compared to $95.9 million and $(4.0) million in the third quarter of 2014. Revenues during the third quarter of 2015 increased compared to the third quarter of 2014 due to the impact of the full 2015 third quarter including the results of the acquisition of Compressor Systems, Inc. (CSI) compared to a partial quarter of CSI results included in the third quarter of 2014. As of September 30, 2015, the horsepower utilization rate of our compressor packages was 81.9% compared to 85.8% at the end of the prior year quarter. Utilization in our over 800 horsepower category remains above 90% while utilization of our below 800 horsepower equipment has decreased sequentially and year over year. We define the horsepower utilization rate as the amount of horsepower of compressor packages used to provide services as of a particular date, divided by the total horsepower of compressor packages in our service fleet as of such date.
Compared to the second quarter of 2015, compression and related services revenues in the third quarter of 2015 was unchanged at $72.8 million, which reflects the continued impact of low commodity prices on the demand for production enhancement compression services as well as increased competition and pricing pressures throughout our compression services line. Aftermarket services revenues increased by $2.3 million, or 50%, from the prior quarter with a large volume of projects completed and revenue recognized in the third quarter. Sales of equipment and parts were up by $0.2 million in the third quarter of 2015 over the prior quarter as we continue to complete a backlog of projects delayed at the onset of the current downturn in oil and gas prices and recognize the associated revenues. Our equipment sales backlog as of the end of the third quarter was $46.1 million, a decline of $40.8 million compared to prior quarter, reflecting the slowdown in upstream and midstream investment activity as a result of depressed oil and natural gas prices.
Unaudited results of operations for the three and nine month periods ended September 30, 2015 compared to the corresponding prior year periods are presented in the financial tables below.
Timothy A. Knox, President of CSI Compressco, remarked, "We are pleased with our record quarterly revenues and strong EBITDA performance in the third quarter, which allowed us to stay on the path of increasing distributions while maintaining a conservative 1.25x distribution coverage ratio. Strong revenues in aftermarket services, recognition of equipment sales from completed projects, and overall steady compression services fleet performance each contributed to this positive outcome in still a difficult and challenging environment.
Capital investments continue to be made in the areas where fleet utilization and demand remain strongest, especially in South Texas and the Permian Basin, with large horsepower compression equipment additions directed primarily in support of customer's central delivery points and gathering systems.
In light of the continued decline in backlog and ongoing challenges in the demand for equipment sales, CSI Compressco continues to implement cost control initiatives to align our manufacturing operations with the reduced activity levels, allowing us to maximize profitability and distribution coverage ratios."
Third Quarter Distribution
On October 20, 2015, CSI Compressco announced that the board of directors of its general partner declared a cash distribution attributable to the third quarter of 2015 of $0.5025 per outstanding unit, which will be paid on November 13, 2015 to unitholders of record as of the close of business on October 30, 2015. The distribution coverage ratio (which is a Non-GAAP Financial Measure defined and reconciled to the closest GAAP financial measure below) for the third quarter of 2015 was 1.25x.
Conference Call
CSI Compressco will host a conference call to discuss third quarter 2015 results today, November 5, 2015, at 10:30 a.m. Eastern Time. The phone number for the call is 866/374-8397. The conference will also be available by live audio webcast and may be accessed through the CSI Compressco website at www.csicompressco.com.
CSI Compressco Overview
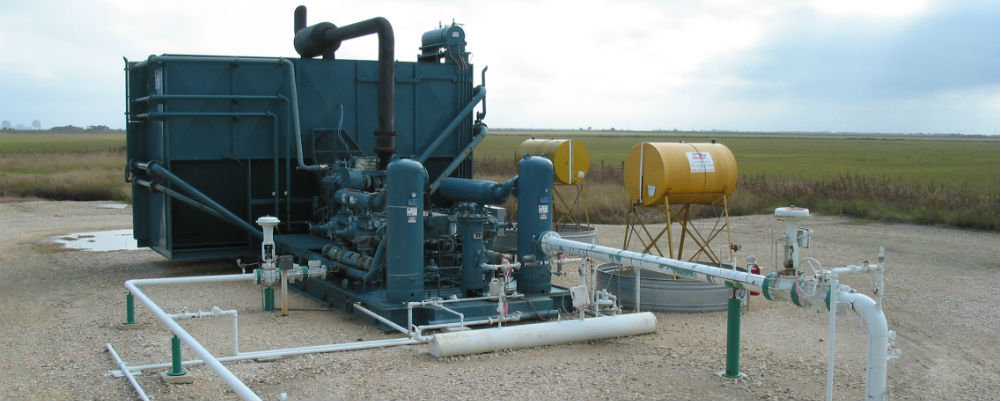
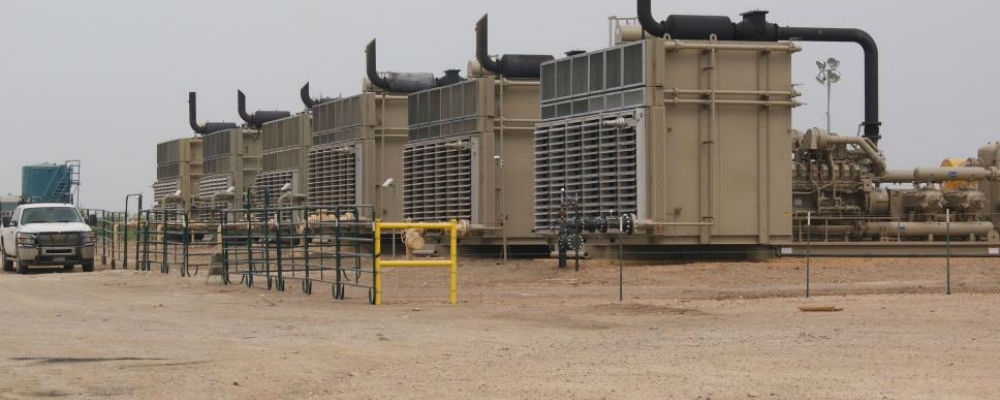
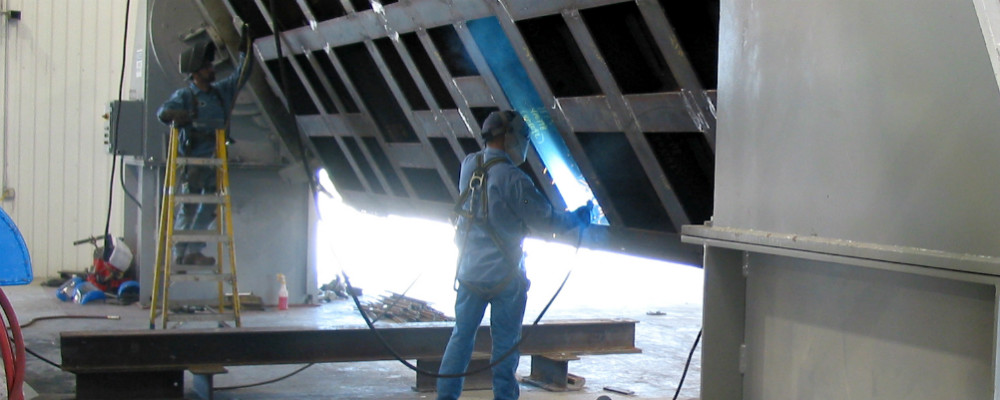
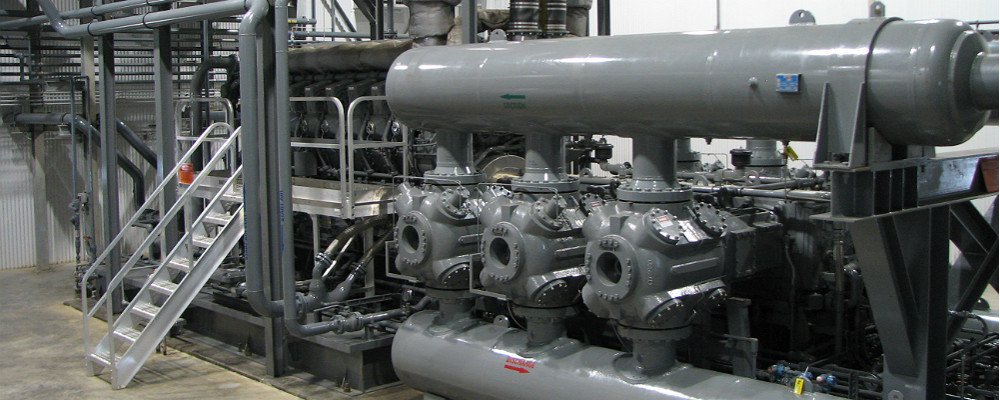
CSI Compressco LP is a provider of compression services and equipment for natural gas and oil production, gathering, transportation, processing, and storage. CSI Compressco's compression and related services business includes a fleet of over 6,500 compressor packages providing in excess of 1.1 million in aggregate horsepower, utilizing a full spectrum of low-, medium-, and high-horsepower engines. CSI Compressco also provides well monitoring and automated sand separation services in conjunction with compression services in Mexico. CSI Compressco's equipment and parts sales business includes the fabrication and sale of standard compressor packages, custom-designed compressor packages, and oilfield fluid pump systems designed and fabricated primarily at our facilities in Midland, Texas and Oklahoma City, Oklahoma, as well as the sale of compressor package parts and components manufactured by third-party suppliers. CSI Compressco's aftermarket services business provides compressor package reconfiguration and maintenance services. CSI Compressco's customers comprise a broad base of natural gas and oil exploration and production, mid-stream, transmission, and storage companies operating throughout many of the onshore producing regions of the United States as well as in a number of foreign countries, including Mexico, Canada, and Argentina. CSI Compressco is managed by CSI Compressco GP Inc., which is an indirect, wholly owned subsidiary of TETRA Technologies, Inc. (NYSE: TTI).
Forward Looking Statements
This press release contains "forward-looking statements" and information based on our beliefs and those of our general partner, CSI Compressco GP Inc. Forward-looking statements in this press release are identifiable by the use of the following words and other similar words: "anticipates", "assumes", "believes", "budgets", "could", "estimates", "expects", "forecasts", "goal", "intends", "may", "might", "plans", "predicts", "projects", "schedules", "seeks", "should, "targets", "will" and "would". These forward-looking statements include statements concerning expected results of operations for 2015, anticipated benefits and growth of CSI Compressco LP following the acquisition of Compressor Systems, Inc. (CSI), including increases in cash distributions per unit, financial guidance, estimated distributable cash, earnings, and earnings per unit, and statements regarding CSI Compressco's beliefs, expectations, plans, goals, future events and performance, and other statements that are not purely historical. Such forward-looking statements reflect our current views with respect to future events and financial performance and are based on assumptions that we believe to be reasonable but such forward-looking statements are subject to numerous risks and uncertainties, including, but not limited to: economic and operating conditions that are outside of our control, including the supply, demand, and prices of crude oil and natural gas; the levels of competition we encounter; the activity levels of our customers; the availability of adequate sources of capital to us; our ability to comply with contractual obligations, including those under our financing arrangements; our operational performance; risks related to acquisitions and our growth strategy; the availability of raw materials and labor at reasonable prices; risks related to our foreign operations; the effect and results of litigation, regulatory matters, settlements, audits, assessments, and contingencies; and other risks and uncertainties contained in our Annual Report on Form 10-K and our other filings with the U.S. Securities and Exchange Commission (SEC), which are available free of charge on the SEC website at www.sec.gov. The risks and uncertainties referred to above are generally beyond our ability to control and we cannot predict all the risks and uncertainties that could cause our actual results to differ from those indicated by the forward-looking statements. If any of these risks or uncertainties materialize, or if any of the underlying assumptions prove incorrect, actual results may vary from those indicated by the forward-looking statements, and such variances may be material. All subsequent written and oral forward-looking statements made by or attributable to us or to persons acting on our behalf are expressly qualified in their entirety by reference to these risks and uncertainties. You should not place undue reliance on forward-looking statements. Each forward-looking statement speaks only as of the date of the particular statement, and we undertake no obligation to update or revise any forward-looking statements we may make, except as may be required by law.
|
Results of operations (unaudited) |
Three Months Ended |
Nine Months Ended | |||||
|
2015 |
2014 |
2015 |
2014 | ||||
|
(In Thousands, Except per Unit Amounts) | |||||||
|
Revenues: |
|||||||
|
Compression and related services |
$ 72,766 |
58,300 |
220,880 |
116,270 | |||
|
Aftermarket services |
7,013 |
6,595 |
21,134 |
6,595 | |||
|
Equipment and parts sales |
49,145 |
30,997 |
116,264 |
34,945 | |||
|
Total revenues |
128,924 |
95,892 |
358,278 |
157,810 | |||
|
Cost of revenues (excluding depreciation and amortization expense): |
|||||||
|
Cost of compression and related services |
36,041 |
30,561 |
110,509 |
61,942 | |||
|
Cost of aftermarket services |
5,407 |
5,266 |
17,774 |
5,266 | |||
|
Cost of equipment and parts sales |
44,667 |
26,622 |
102,624 |
28,617 | |||
|
Total cost of revenues |
86,115 |
62,449 |
230,907 |
95,825 | |||
|
Selling, general, and administrative expense |
10,469 |
10,163 |
32,272 |
19,265 | |||
|
Depreciation and amortization |
20,610 |
13,476 |
61,227 |
20,909 | |||
|
Interest expense, net |
8,201 |
4,998 |
24,068 |
5,302 | |||
|
Other expense, net |
1,514 |
8,758 |
3,923 |
9,795 | |||
|
Income (loss) before income tax provision |
2,015 |
(3,952) |
5,881 |
6,714 | |||
|
Provision (benefit) for income taxes |
396 |
(1,351) |
1,291 |
(183) | |||
|
Net income (loss) |
$ 1,619 |
$ (2,601) |
$ 4,590 |
$ 6,897 | |||
|
Net income per diluted common unit |
$ 0.04 |
$ (0.10) |
$ 0.10 |
$ 0.35 | |||
Reconciliation of Non-GAAP Financial Measures
The Partnership includes in this release the non-GAAP financial measures EBITDA, Adjusted EBITDA, distributable cash flow and distribution coverage ratio. EBITDA and Adjusted EBITDA are used as supplemental financial measures by the Partnership's management to:
- assess the Partnership's ability to generate available cash sufficient to make distributions to the Partnership's unitholders and general partner;
- evaluate the financial performance of the Partnership's assets without regard to financing methods, capital structure or historical cost basis;
- measure operating performance and return on capital as compared to those of our competitors; and
- determine the Partnership's ability to incur and service debt and fund capital expenditures.
The Partnership defines EBITDA as earnings before interest, taxes, depreciation and amortization. Adjusted EBITDA is defined as EBITDA excluding equity compensation, transaction costs, and amortized finance costs.
Distributable cash flow is used as a supplemental financial measure by the Partnership's management as it provides important information relating to the relationship between our financial operating performance and our cash distribution capability. Additionally, the Partnership uses distributable cash flow in setting forward expectations and in communications with the board of directors of our general partner. The Partnership defines distributable cash flow as EBITDA less current income tax expense, maintenance capital expenditures, and interest expense, plus the non-cash cost of compressors sold, non-cash charges and losses that are unusual or non-recurring, and equity compensation expense. The Partnership believes that the distribution coverage ratio provides important information relating to the relationship between the Partnership's financial operating performance and its cash distribution capability. The Partnership defines the distribution coverage ratio as the ratio of distributable cash flow to the total quarterly distribution payable, which includes, as applicable, distributions payable on all outstanding common and subordinated units, the general partner interest, and the general partner's incentive distribution rights.
These non-GAAP financial measures should not be considered alternatives to net income, operating income, cash flows from operating activities or any other measure of financial performance presented in accordance with GAAP. These non-GAAP financial measures may not be comparable to EBITDA, Adjusted EBITDA, distributable cash flow or other similarly titled measures of other entities, as other entities may not calculate these non-GAAP financial measures in the same manner as the Partnership. Management compensates for the limitation of these non-GAAP financial measures as an analytical tool by reviewing the comparable GAAP measures, understanding the differences between the measures and incorporating this knowledge into management's decision making process. Furthermore, these non-GAAP measures should not be viewed as indicative of the actual amount of cash that the Partnership has available for distributions or that the Partnership plans to distribute for a given period, nor should they be equated to available cash as defined in the Partnership's partnership agreement.
The following table reconciles net income to EBITDA for the three and nine month periods ended September 30, 2015 and 2014:
|
Three Months Ended |
Nine Months Ended | ||||||
|
2015 |
2014 |
2015 |
2014 | ||||
|
(In Thousands) | |||||||
|
Net income |
$ 1,619 |
$ (2,601) |
$ 4,590 |
$ 6,897 | |||
|
Provision for income taxes |
396 |
(1,351) |
1,291 |
(183) | |||
|
Depreciation and amortization |
20,610 |
13,476 |
61,227 |
20,909 | |||
|
Interest expense, net |
8,201 |
4,998 |
24,068 |
5,302 | |||
|
EBITDA |
$ 30,826 |
$ 14,522 |
$ 91,176 |
$ 32,925 | |||
The following table reconciles EBITDA to Adjusted EBITDA for the three and nine month periods ended September 30, 2015 and September 30, 2014:
|
Three Months Ended |
Nine Months Ended | ||||||
|
2015 |
2014 |
2015 |
2014 | ||||
|
(In Thousands) | |||||||
|
EBITDA |
$ 30,826 |
$ 14,522 |
$ 91,176 |
$ 32,925 | |||
|
Equity Compensation |
455 |
482 |
1,659 |
919 | |||
|
Amortized finance costs |
697 |
1,289 |
2,089 |
1,421 | |||
|
Transaction costs |
— |
9,769 |
208 |
10,624 | |||
|
Adjusted EBITDA |
$ 31,978 |
$ 26,062 |
$ 95,132 |
$ 45,889 | |||
|
Transaction related costs in SG&A |
$ — |
$ 855 |
$ 208 |
$ 855 | |||
The following table reconciles net income to distributable cash flow and distribution coverage ratio for the three and nine month periods ended September 30, 2015 and September 30, 2014:
|
Three Months Ended |
Nine Months Ended | ||||||
|
2015 |
2014 |
2015 |
2014 | ||||
|
(In Thousands) | |||||||
|
Net income |
$ 1,619 |
$ (2,601) |
$ 4,590 |
$ 6,897 | |||
|
Provision for income taxes |
396 |
(1,351) |
1,291 |
(183) | |||
|
Depreciation and amortization |
20,610 |
13,476 |
61,227 |
20,909 | |||
|
Interest expense, net |
8,201 |
4,998 |
24,068 |
5,302 | |||
|
EBITDA |
$ 30,826 |
$ 14,522 |
$ 91,176 |
$ 32,925 | |||
|
Less: |
|||||||
|
Current income tax (expense) benefit |
1,296 |
285 |
(33) |
(1,024) | |||
|
Maintenance capital expenditures |
(3,665) |
(1,845) |
(7,869) |
(2,086) | |||
|
Interest Expense |
(8,201) |
(4,998) |
(24,068) |
(5,302) | |||
|
Plus: |
|||||||
|
Non-cash cost of compressors sold |
399 |
304 |
605 |
371 | |||
|
Equity Compensation |
455 |
482 |
1,659 |
919 | |||
|
Amortization of finance costs |
697 |
1,289 |
2,089 |
1,421 | |||
|
Transaction related expenses |
— |
9,769 |
208 |
10,624 | |||
|
Distributable cash flow |
21,807 |
19,808 |
63,767 |
37,848 | |||
|
Cash distribution attributable to period |
$ 17,405 |
$ 15,631 |
$ 51,796 |
$ 29,898 | |||
|
Distribution coverage ratio |
1.25x |
1.27x |
1.23x |
1.27x | |||
SOURCE CSI Compressco LP
